Illegal Parking
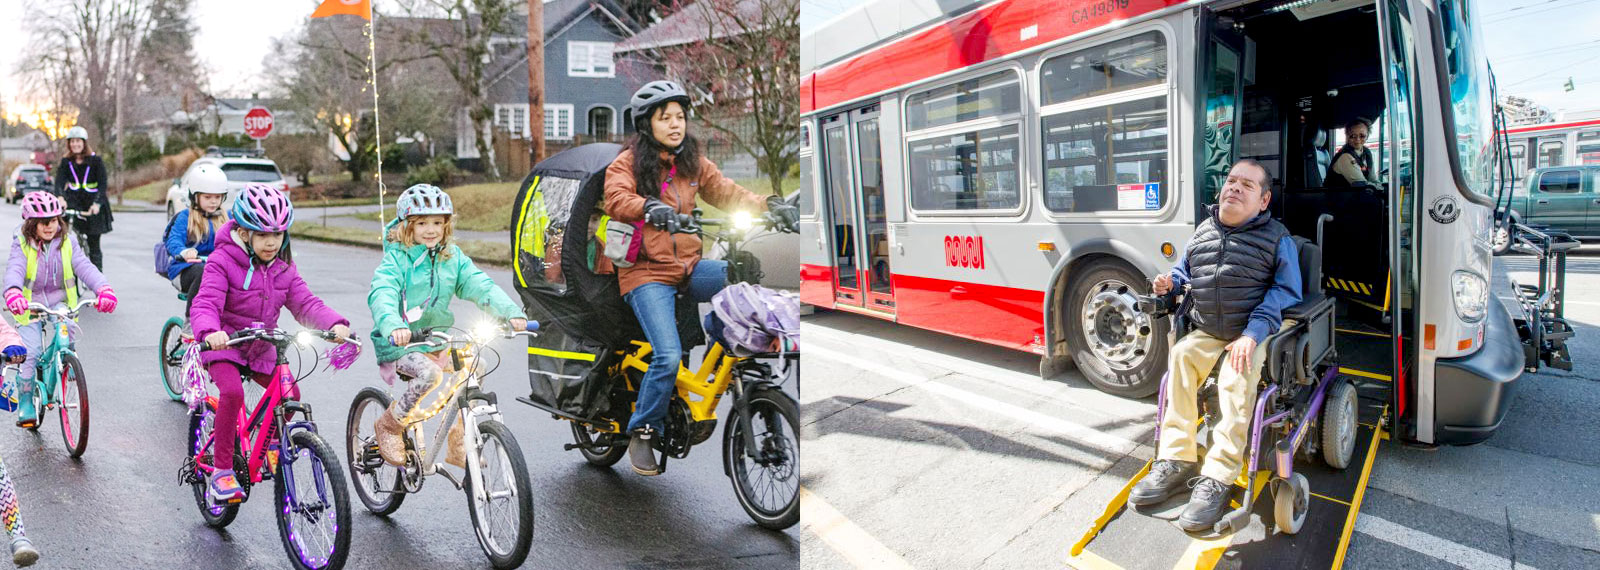
Parking enforcement is a critical public safety function. Parking on sidewalks and in accessibility zones forces families with strollers and people with disabilities into traffic. Blocking bike lanes create hazards for people biking, while double parking creates dangerous conditions and slows transit. You've likely experienced all of these unsafe conditions and more if you bike, walk, or take transit in San Francisco. Anecdotally, things seem to be getting worse. So we decided to dig into the data: What is the SFMTA doing to enforce parking violations that impact public safety?
The SFMTA writes approximately 1 million parking tickets each year, citing about 300 different ways you can illegally park a motor vehicle on San Francisco's streets. This project analyzes over 19 million illegal parking citations issued by the SFMTA since 2008, as well as 300 thousand complaints. We analyzed the data to answer some critical questions:
The SFMTA must rethink its parking enforcement strategy. We need enforcement that prioritizes keeping streets safe for everyone instead of harvesting revenue from street cleaning violations. The SFMTA must focus on safety-related violations, enforce them quickly and consistently, increase fines for repeat offenders and make citizen reporting easy and effective for safety-critical violations.

Parking Enforcement
by the Numbers:
Revenue over Safety
The data shows that, year over year, the two most aggressively cited illegal parking violations are street cleaning and overtime parking violations. These two violations alone account for over 70% of all SFMTA enforcement activity, despite having no impact on public safety. Meanwhile, the rampant violations that affect people who walk, bike or take transit – blocking a bike lane, sidewalk, bus stop or accessibility space – together constitute just 5% of all enforcement activity.

revenue stream for the SFMTA

and our most vulnerable residents

SF311 is Inadequate
to the Task
SF311 is San Francisco's reporting platform for non-emergencies and allows residents to report illegal parking violations via their phone or the SF311 website or app. However, the app is poorly designed and the data it generates is not well used by the SFMTA.
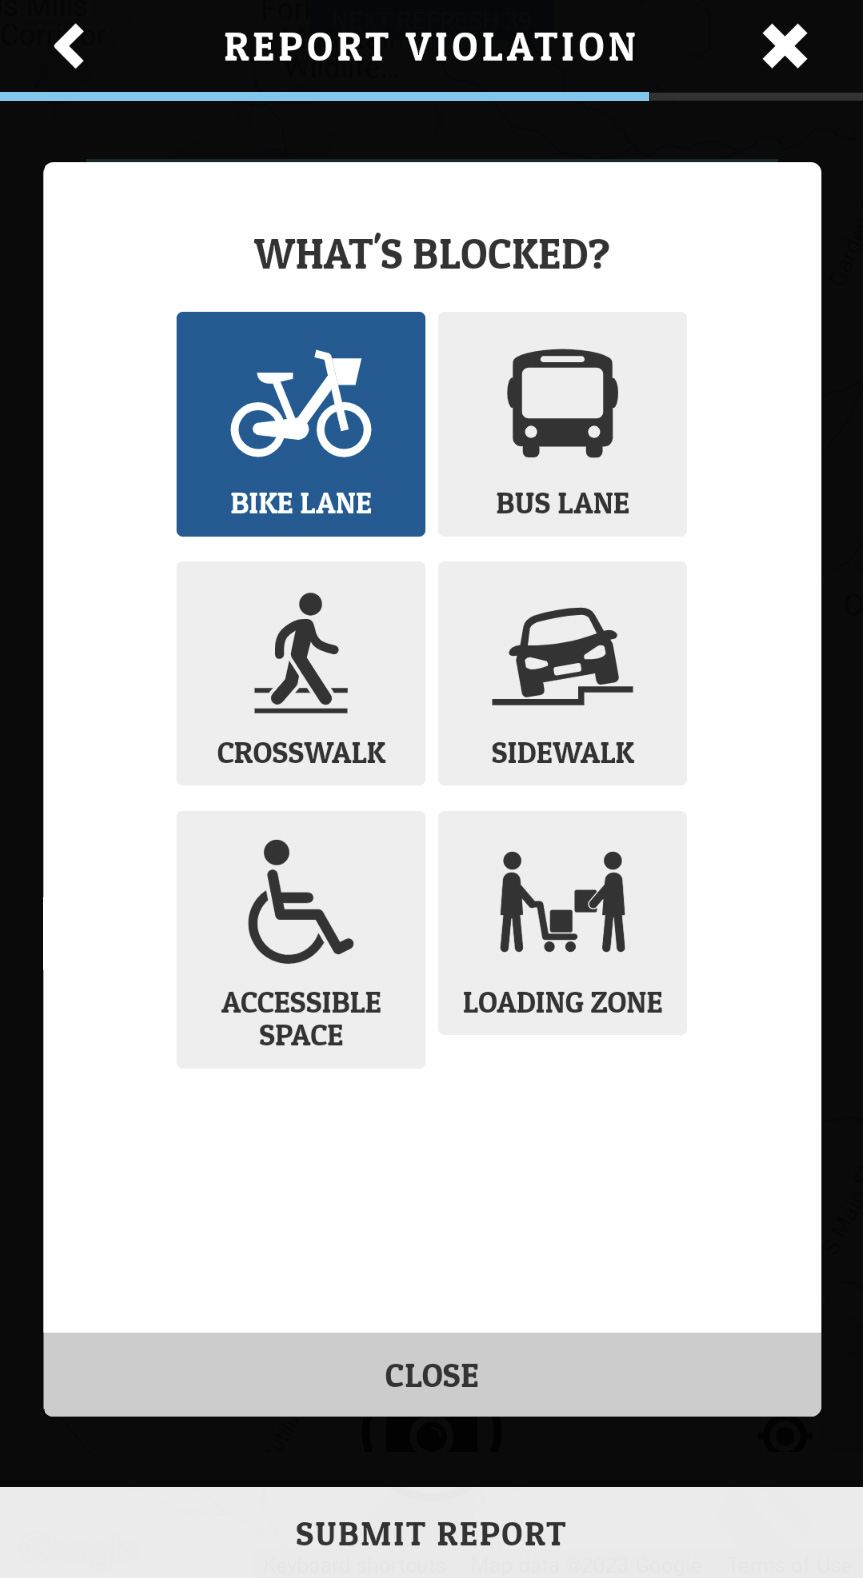
The SF311 app (below) provides a basic reporting interface that prioritizes vehicles blocking private driveways over those that block the public right of way. A better approach is demonstrated by Safe Lanes, a free app we built in 2019 to provide a faster, more accurate way to report illegal parking violations to SF311. Safe Lanes prioritizes safety critical violations, alerts the user to repeat offenders and automatically reads the license plate and location data in the photos you take. To date, over 30,000 illegal parking reports have been submitted to SF311 via Safe Lanes.
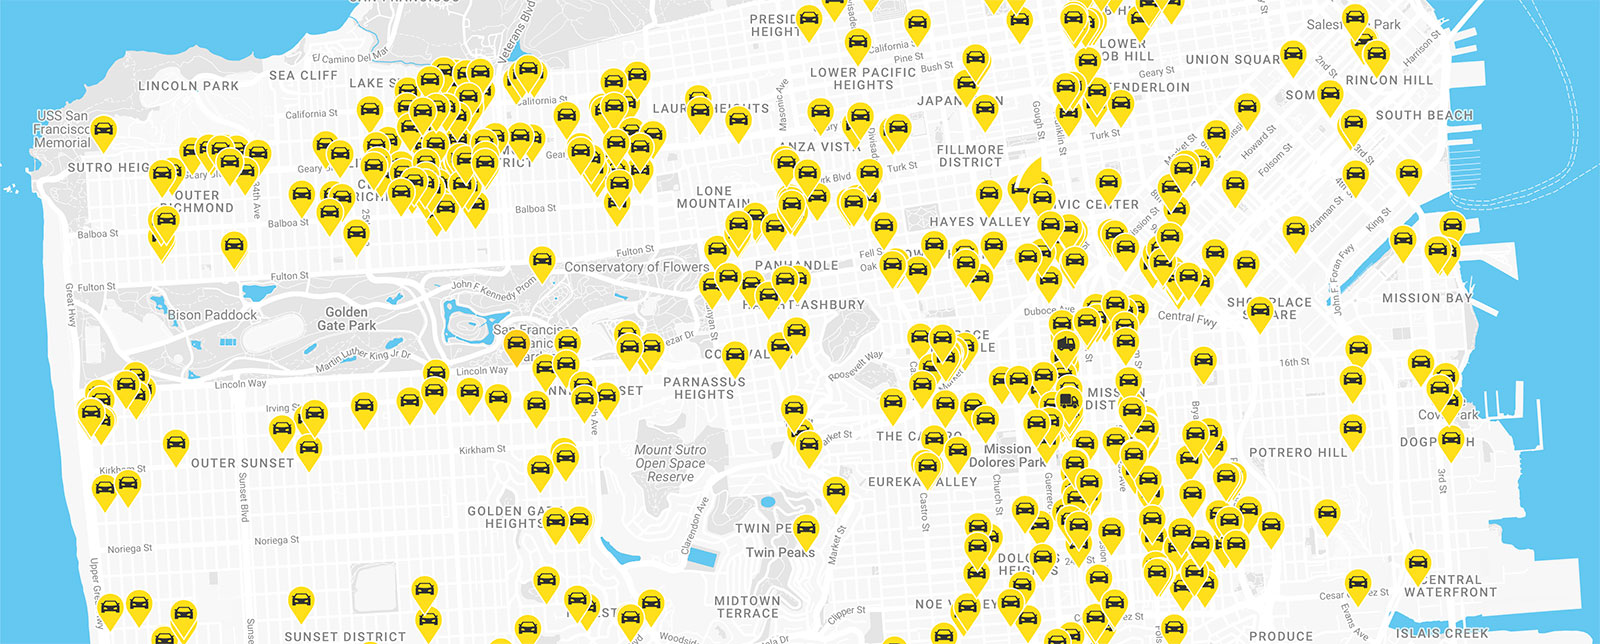
Even when the SF311 app is used, few complaints result in a citation. Of the approximately 250 illegal parking complaints submitted to SF311 daily, fewer than 25% result in a citation. The SFMTA needs a data-driven, dynamic enforcement strategy that responds faster and ensures more complaints result in a citation. One way to approach this is to automatically assign the nearest parking control officer (PCO) to each complaint as they come in and have PCOs on standby in known hot spots. Instead Shawn McCormick, director of parking enforcement at SFMTA, explains how he uses low-fidelity heat maps to guide parking enforcement at a recent hearing at City Hall.
Response times are also poor and weighted towards the needs of property owners. In 2022, the SFMTA received 21,982 complaints for vehicles blocking a driveway and 14,332 complaints for vehicles blocking the sidewalk. The average response time to a blocked driveway violation in 2022 was 4 hours, 16 minutes and 27 seconds while the average response time to a blocked sidewalk violation was 5 hours, 23 minutes 38 seconds. All of these response times are too high, but it is unconscionable that it takes the SFMTA a full hour longer on average to respond to sidewalk violations that impact public safety.
In addition to revamping their reporting tools and response times, the SFMTA should also explore incentives for reporting egregious violations. The Citizens Air Complaint Program in New York City has shown such programs to be highly effective at increasing reporting and reducing infractions. The SFMTA must provide the public with effective reporting tools that prioritize safety critical violations, and then respond in minutes, not hours. Until they do, they will never earn the public's trust or know the full scale of illegal parking violations in San Francisco as most people won't waste their time using a platform that outright ignores their concerns.

Repeat Offenders
are Everywhere
There are approximately 466,000 registered cars in San Francisco and approximately 456,000 people drive into the city each day. We all make mistakes: it’s easy to forget to feed a meter or move your vehicle for street cleaning. However some drivers clearly could care less about parking restrictions and continue to rack up thousands of citations and hundreds of thousands in dollars in fines.
Repeat offenders are not just harming themselves. In the most extreme cases, drivers who repeatedly disregard minor infractions can go on to cause significant harm to others: in March 2023, for example, a driver in Washington D.C. with 43 speeding tickets slammed into a Honda sedan, killing all three passengers inside. It is a statistical inevitability that the more drivers disregard codes and put vulnerable road users in harm’s way, the more likely serious injuries and deaths and become. Drivers who repeatedly endanger the public must be held accountable.
To better target these problematic repeat offenders, who pose threats to both safety and public order, the SFMTA needs to harden its enforcement strategy: it could raise fines for these serial violators or even push for the revocation of driving privileges. But first, they should be accelerating infrastructure improvements which make it harder if not impossible to illegally park a vehicle in the first place. As this interactive map of the 50 most egregious repeat offenders shows, repeat offenders in some locations are likely commercial delivery drivers who could benefit from more loading zones. Similarly, if the SFMTA built actual protected bike lanes that use concrete barriers instead of plastic sticks, fewer drivers would be able to park in them.

Enforcement is Inconsistent
on Retail Corridors
We analyzed illegal parking behavior on 14 major retail corridors Valencia Street, Polk Street, Haight Street, Fillmore Street, Clement Street, Grant Avenue, Columbus Avenue, Market Street, Union Street, Third Street, Union Square, Inner Sunset, The Castro and Fisherman's Wharf and found:
- Parking enforcement is very inconsistent throughout the week
- There is almost no parking enforcement on Sundays
- Citations for non-safety violations outnumber safety-critical violations on average 5 to 1
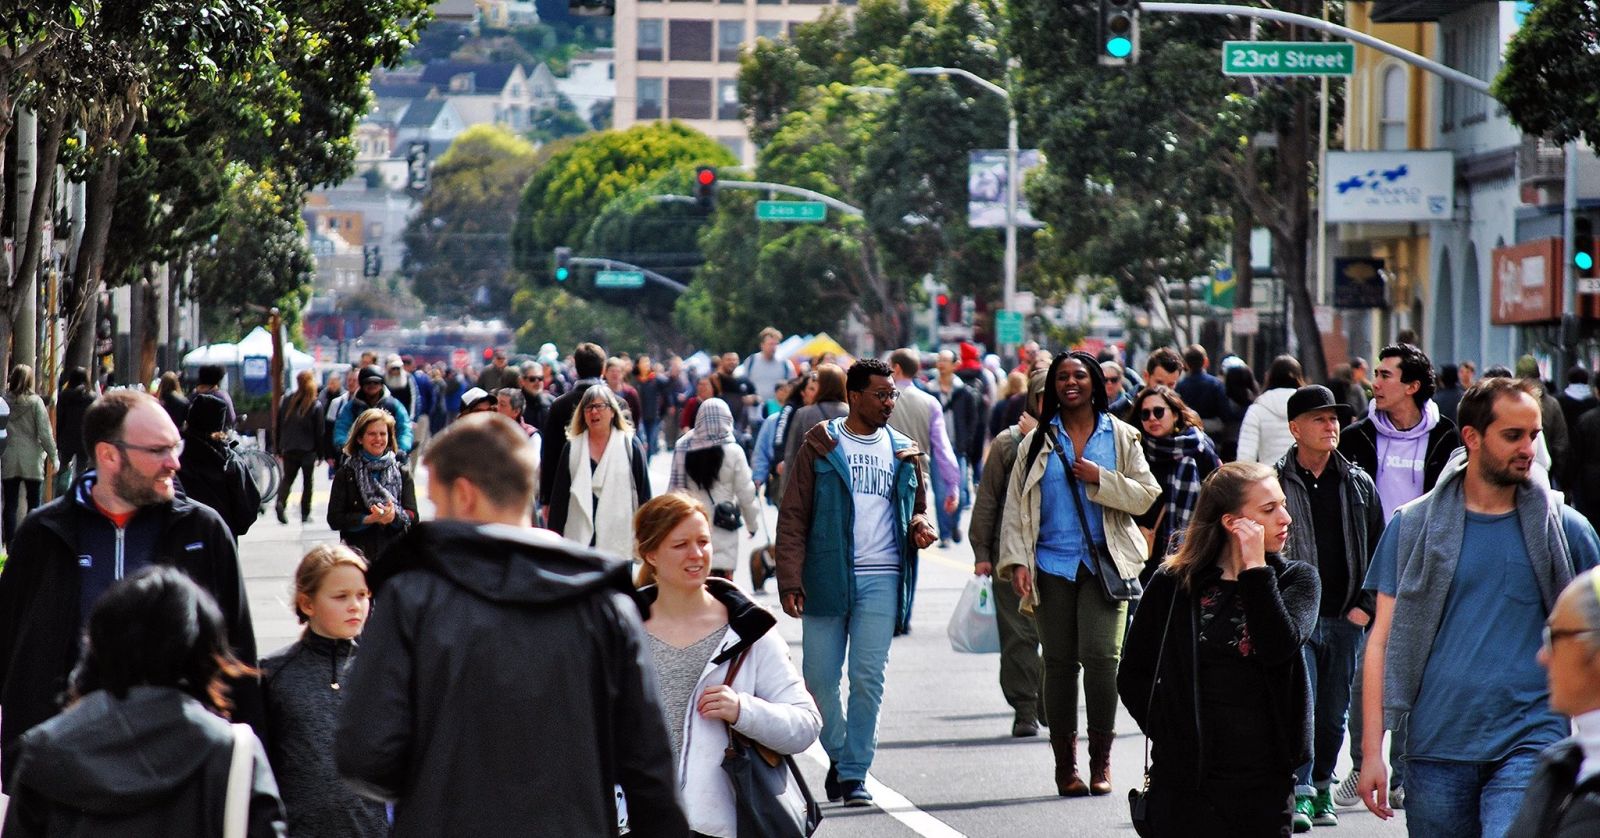
San Francisco's retail corridors are its most active public spaces aside from its parks and must be safe and accessible for all visitors. The SFMTA must prioritize parking enforcement along retail corridors and ensure that businesses have abundant space to accept deliveries.


Valencia Street


Polk Street


Haight Street


Fillmore Street


Clement Street


Grant Avenue


Columbus Avenue


Market Street


Union Street


Third Street


Union Square


Inner Sunset


The Castro


Fisherman's Wharf
Conclusion
The data is clear: the SFMTA’s parking enforcement strategy is on revenue-generating autopilot. This is a shame, because parking enforcement is far from being just a costly irritation for absent-minded drivers: it is a critical tool for keeping everyone safe on our streets. The SFMTA must reform its reporting tools, tighten response times, and focus enforcement actions on safety-critical violations and the most egregious repeat offenders. Most importantly, the SFMTA Board, the Mayor and the Board of Supervisors must apply and maintain pressure on the organization until this is done.

