%20--%3e%3csvg%20version='1.1'%20id='Layer_1'%20xmlns='http://www.w3.org/2000/svg'%20xmlns:xlink='http://www.w3.org/1999/xlink'%20x='0px'%20y='0px'%20viewBox='0%200%20400%20400'%20style='enable-background:new%200%200%20400%20400;'%20xml:space='preserve'%3e%3cstyle%20type='text/css'%3e%20.st0{fill:%23FFFFFF;}%20%3c/style%3e%3cg%3e%3cpath%20class='st0'%20d='M203.3,185.4h168.9c7.8,0,14.2,6.3,14.2,14.2c0,7.8-6.3,14.2-14.2,14.2H203.3c-7.8,0-14.2-6.3-14.2-14.2%20S195.5,185.4,203.3,185.4z'/%3e%3cpath%20class='st0'%20d='M27.3,332.1h344.9c7.8,0,14.2,6.3,14.2,14.2c0,7.9-6.3,14.2-14.2,14.2H27.3c-7.8,0-14.2-6.3-14.2-14.2%20C13.1,338.4,19.4,332.1,27.3,332.1z'/%3e%3cpath%20class='st0'%20d='M27.3,38.7h344.9c7.8,0,14.2,6.3,14.2,14.2s-6.3,14.2-14.2,14.2H27.3c-7.8,0-14.2-6.3-14.2-14.2%20S19.4,38.7,27.3,38.7z'/%3e%3c/g%3e%3c/svg%3e)


%20--%3e%3csvg%20version='1.1'%20id='Layer_1'%20xmlns='http://www.w3.org/2000/svg'%20xmlns:xlink='http://www.w3.org/1999/xlink'%20x='0px'%20y='0px'%20viewBox='0%200%20400%20400'%20style='enable-background:new%200%200%20400%20400;'%20xml:space='preserve'%3e%3cstyle%20type='text/css'%3e%20.st0{fill:none;stroke:%23FFFFFF;stroke-width:7;}%20.st1{fill:%23FFFFFF;stroke:%23FFFFFF;stroke-miterlimit:10;}%20%3c/style%3e%3ccircle%20class='st0'%20cx='200'%20cy='200.3'%20r='192.4'/%3e%3cpath%20class='st1'%20d='M197,304.5c1.6,1.6,4.2,1.6,5.8,0l26.3-26.3c1.6-1.6,1.6-4.2,0-5.8c-1.6-1.6-4.2-1.6-5.8,0L200,295.7%20l-23.4-23.4c-1.6-1.6-4.2-1.6-5.8,0s-1.6,4.2,0,5.8L197,304.5z%20M195.8,95v206.5h8.3V95H195.8z'/%3e%3c/svg%3e)
%20--%3e%3csvg%20version='1.1'%20id='Layer_1'%20xmlns='http://www.w3.org/2000/svg'%20xmlns:xlink='http://www.w3.org/1999/xlink'%20x='0px'%20y='0px'%20viewBox='0%200%20400%20400'%20style='enable-background:new%200%200%20400%20400;'%20xml:space='preserve'%3e%3cstyle%20type='text/css'%3e%20.st0{fill:%23010101;}%20%3c/style%3e%3cpath%20class='st0'%20d='M230,76.4c-1.8-26.3,12.3-48.3,36.6-56.8c23.1-8.1,49.1,0.3,63,20.4c14,20.3,12.8,47.6-2.6,66.3%20c-16,19.3-42.9,26.1-65.9,14.1c-9.7-5.1-15.1-2.6-22.3,2.9c-21.1,16.2-71.7,59.9-73.4,68.6c-5.8,28.5,11.3,41.3,31,54.3%20c14.1,9.4,27.4,20,40.6,30.7c8.1,6.6,14.9,8.8,25.6,3.5c22.8-11.3,48-4.7,64.2,14.5c14.9,17.6,16.9,43.6,4.9,63.4%20c-12.7,21-37.4,30.9-61.6,24.7c-26.6-6.9-43.5-31.6-39.3-61.1c1.5-10.9-1.6-16.3-9.8-22.1c-21.6-15.4-42.8-31.5-63.8-47.7%20c-7-5.4-12.2-6.7-21-2.3c-24.1,11.9-51.3,5-67.3-15.1c-15.4-19.4-15.5-48.3-0.1-67.8c16.1-20.4,42.5-27.1,67-15.3%20c8.6,4.1,13.9,3.4,21.1-2.2c20-15.7,40.6-30.6,61-45.9C226.8,96.9,230.9,87.8,230,76.4L230,76.4z'/%3e%3c/svg%3e)
In 2014, San Francisco instituted a Vision Zero program committing the city to zero traffic related fatalities by 2024. Since San Francisco's Vision Zero program went into effect 12 years ago, 381 people have been killed and 3,769 have been seriously injured by impatient and distracted drivers on its streets.
According to the San Francisco Department of Public Health, a driver crashes their car AND injures someone with it approximately every 2.88 hours in San Francisco. That is more than 8 times per day, every single day and yet the majority of San Francisco's elected officials refuse to take this public health crisis seriously or even acknowledge when a pedestrian is killed in their district.
As San Francisco continues to lose approximately 40 people to traffic violence each year, it is clear that the city's current approach to Vision Zero isn't working. Instead of spending millions on signs and awareness campaigns that drivers ignore, San Francisco should be investing in infrastructure projects that prioritize pedestrians, force drivers to slow down and make it safer to walk, bike and scoot across the city.
This project is a live dashboard and map that tracks every motor vehicle related fatality on San Francisco's streets and attempts to identify the victims and circumstances surrounding each crash. The goal of this project is to help you work with your elected officials to demand they take immediate and aggressive action to slow our streets and prioritize your family's safety over driver convenience and the expediency of cars.
Motor Vehicle Fatalities by Year
Since San Francisco adopted its Vision Zero program in 2014, 381 people have been killed by traffic violence on its streets. That equates to a traffic related fatality every 11.90 days. The most recent fatality was on May 25th which was about 2 months ago. San Francisco was due to experience its next traffic related fatality on June 6th which was 41 days ago. As of today, July 17th, there have been 9 traffic related fatalities so far this year. San Francisco currently averages about 40 traffic related fatalities each year.
Motor Vehicle Fatalities Running Average
This chart shows San Francisco's current daily running average of traffic fatalities for the year. This is calculated by dividing the number of days since the beginning of the year for each fatality by the number of fatalites recorded by that date, divided by 365. As times passes without a fatality, the daily running average decreases and conversely rises when someone is killed.
Motor Vehicle Injuries by Month
Approximately every 2.88 hours a driver crashes their car and injures someone with it in San Francisco. This chart shows the number of vehicle related injuries by month and the victim's mode of transit.
Crash data is sourced from the San Francisco Department of Public Health who typically publish new data every 3 months. The most recent data available is through May 31st, 2026.
Motor Vehicle Injuries By Supervisor District
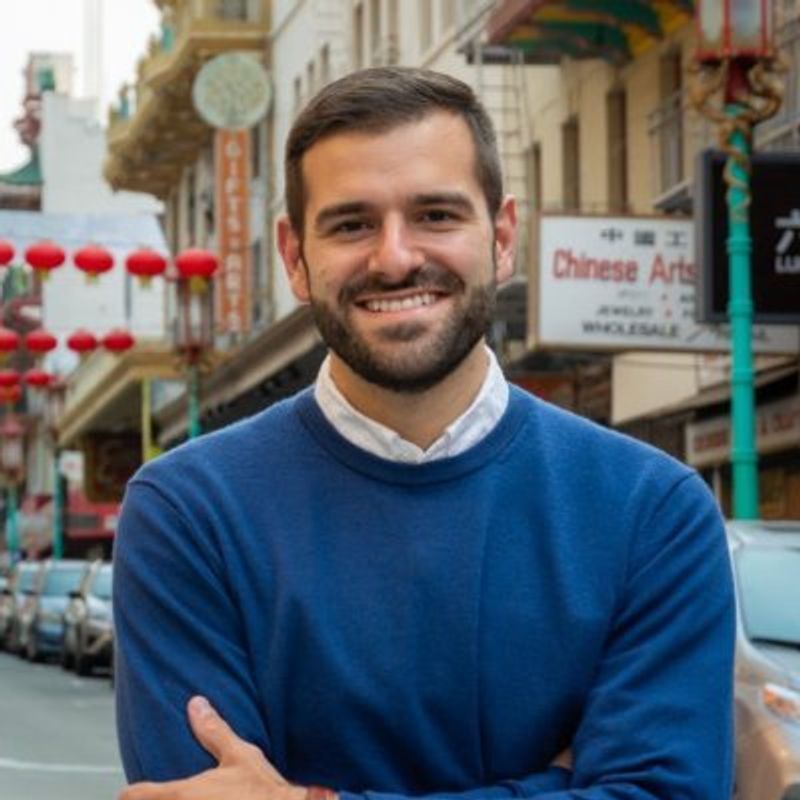
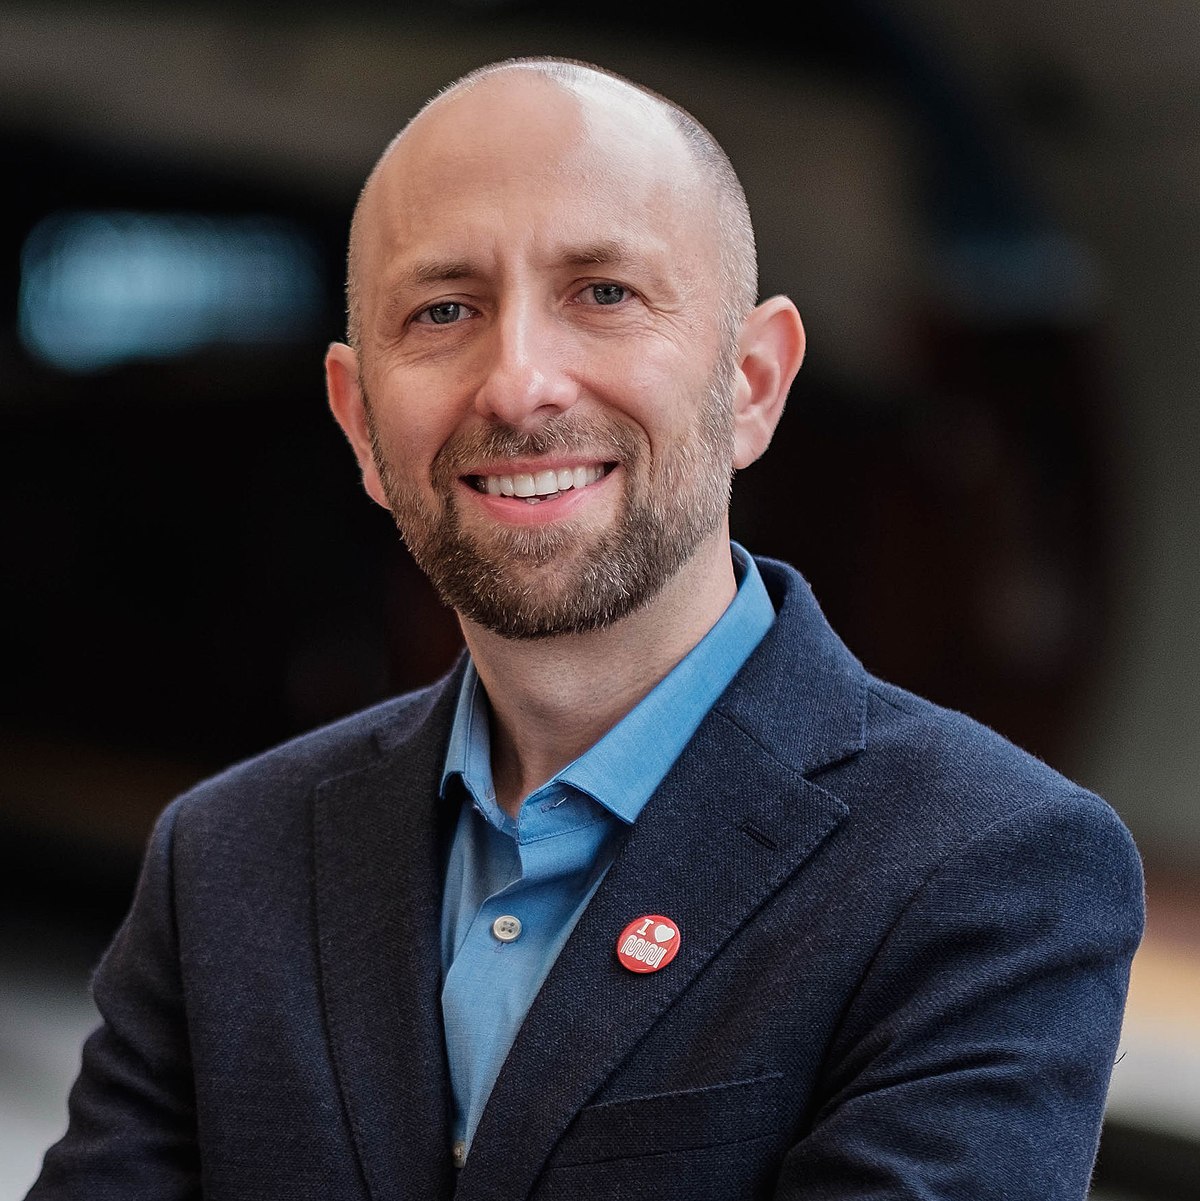
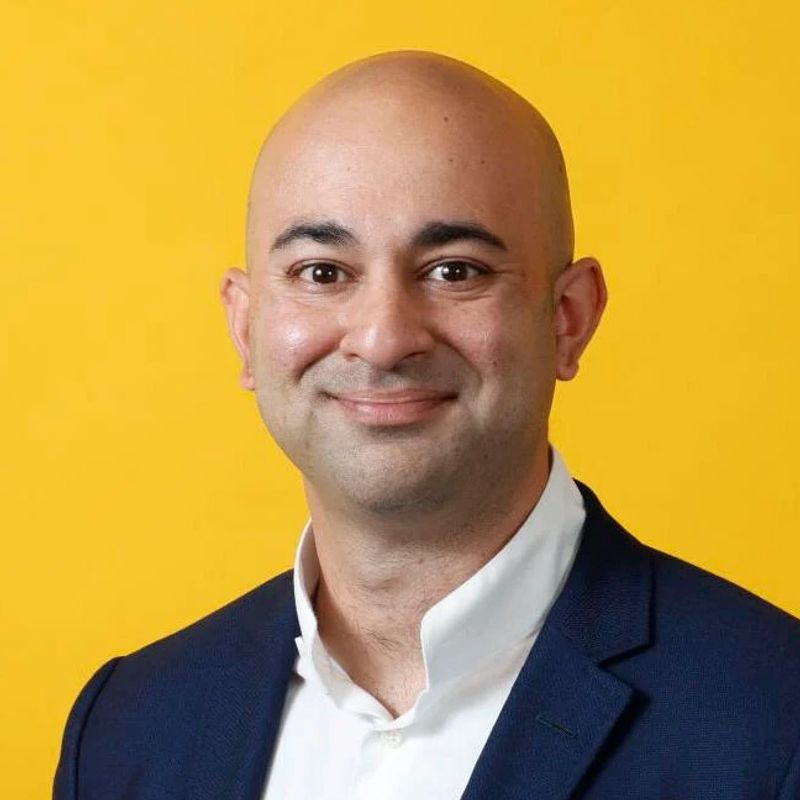
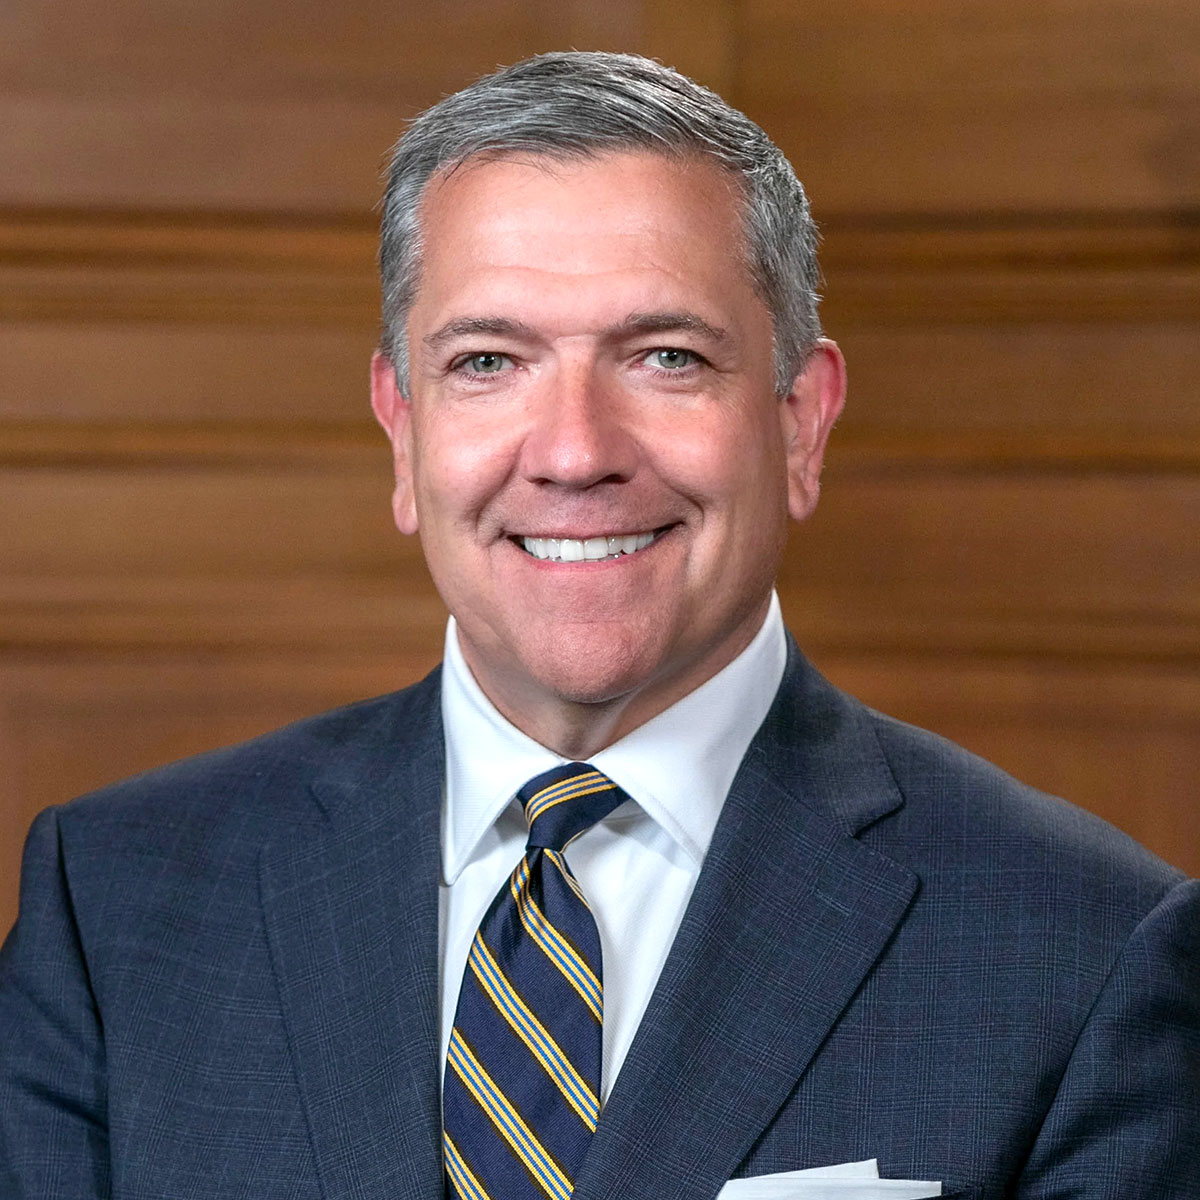
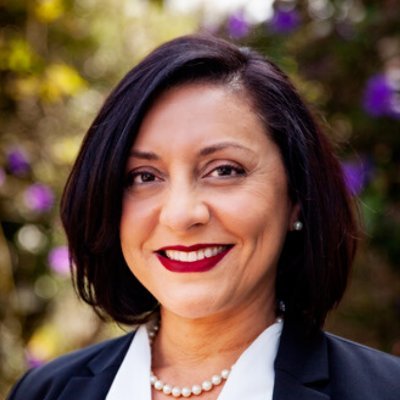
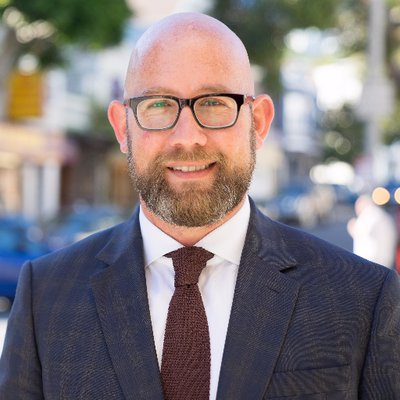
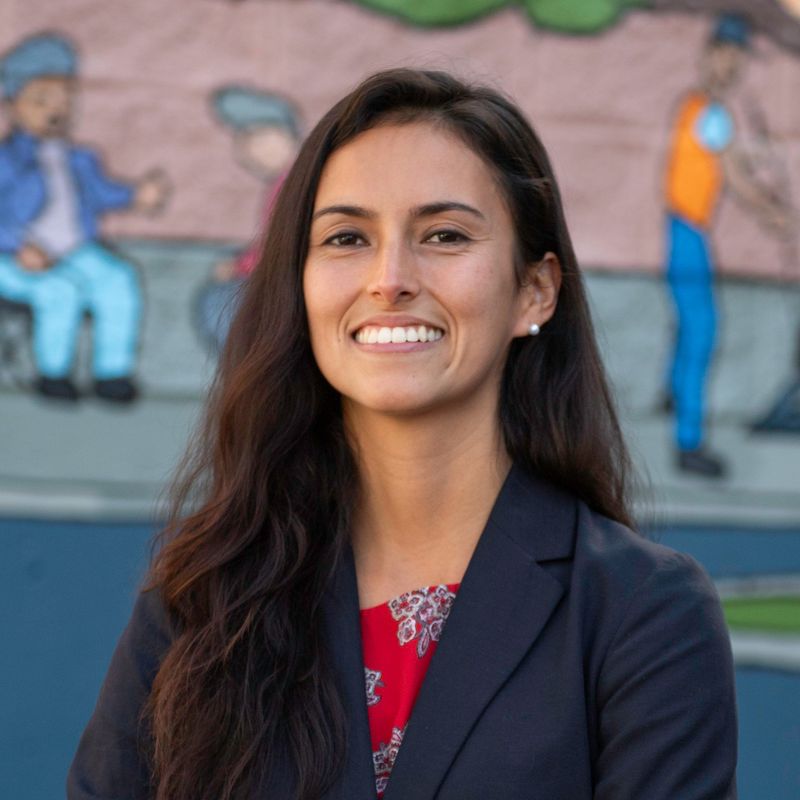
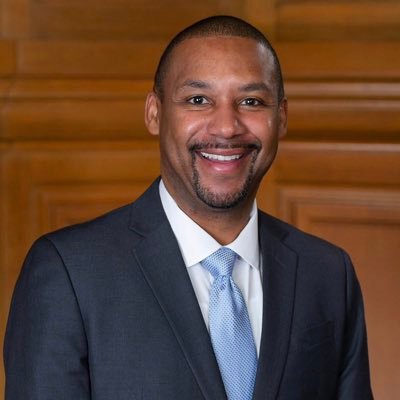
A safe, healthy and equitable city starts and ends with political will. All of the elected officials below have the authority to direct the San Francisco Municipal Transportation Agency to expedite safety improvement projects in their district to protect you and your family. This section tracks the number of vehicle related injuries that have occurred since each elected official has taken office and will soon provide an interactive dashboard that shows how public safety issues in each district are trending over time.


About This Project
The following resources guided our research and we thank the authors for their work:
- A list of people killed in traffic collisions in San Francisco
- A list of people killed while riding a bicycle in San Francisco curated by Patrick Traughber
- A list of pedestrians and cyclists killed in San Francisco in 2015 curated by Bryan Goebel
Crash data is sourced from the San Francisco Department of Public Health who typically publish new data every 3 months. Traffic Fatalities are added as soon as we learn of them.
This project was designed and developed by Stephen Braitsch with research support from Lindsay Meisel.