%20--%3e%3csvg%20version='1.1'%20id='Layer_1'%20xmlns='http://www.w3.org/2000/svg'%20xmlns:xlink='http://www.w3.org/1999/xlink'%20x='0px'%20y='0px'%20viewBox='0%200%20400%20400'%20style='enable-background:new%200%200%20400%20400;'%20xml:space='preserve'%3e%3cstyle%20type='text/css'%3e%20.st0{fill:%23FFFFFF;}%20%3c/style%3e%3cg%3e%3cpath%20class='st0'%20d='M203.3,185.4h168.9c7.8,0,14.2,6.3,14.2,14.2c0,7.8-6.3,14.2-14.2,14.2H203.3c-7.8,0-14.2-6.3-14.2-14.2%20S195.5,185.4,203.3,185.4z'/%3e%3cpath%20class='st0'%20d='M27.3,332.1h344.9c7.8,0,14.2,6.3,14.2,14.2c0,7.9-6.3,14.2-14.2,14.2H27.3c-7.8,0-14.2-6.3-14.2-14.2%20C13.1,338.4,19.4,332.1,27.3,332.1z'/%3e%3cpath%20class='st0'%20d='M27.3,38.7h344.9c7.8,0,14.2,6.3,14.2,14.2s-6.3,14.2-14.2,14.2H27.3c-7.8,0-14.2-6.3-14.2-14.2%20S19.4,38.7,27.3,38.7z'/%3e%3c/g%3e%3c/svg%3e)
%20--%3e%3csvg%20version='1.1'%20id='Layer_1'%20xmlns='http://www.w3.org/2000/svg'%20xmlns:xlink='http://www.w3.org/1999/xlink'%20x='0px'%20y='0px'%20viewBox='0%200%20400%20400'%20style='enable-background:new%200%200%20400%20400;'%20xml:space='preserve'%3e%3cstyle%20type='text/css'%3e%20.st0{fill:none;stroke:%23FFFFFF;stroke-width:7;}%20.st1{fill:%23FFFFFF;stroke:%23FFFFFF;stroke-miterlimit:10;}%20%3c/style%3e%3ccircle%20class='st0'%20cx='200'%20cy='200.3'%20r='192.4'/%3e%3cpath%20class='st1'%20d='M197,304.5c1.6,1.6,4.2,1.6,5.8,0l26.3-26.3c1.6-1.6,1.6-4.2,0-5.8c-1.6-1.6-4.2-1.6-5.8,0L200,295.7%20l-23.4-23.4c-1.6-1.6-4.2-1.6-5.8,0s-1.6,4.2,0,5.8L197,304.5z%20M195.8,95v206.5h8.3V95H195.8z'/%3e%3c/svg%3e)
%20--%3e%3csvg%20version='1.1'%20id='Layer_1'%20xmlns='http://www.w3.org/2000/svg'%20xmlns:xlink='http://www.w3.org/1999/xlink'%20x='0px'%20y='0px'%20viewBox='0%200%20400%20400'%20style='enable-background:new%200%200%20400%20400;'%20xml:space='preserve'%3e%3cstyle%20type='text/css'%3e%20.st0{fill:%23010101;}%20%3c/style%3e%3cpath%20class='st0'%20d='M230,76.4c-1.8-26.3,12.3-48.3,36.6-56.8c23.1-8.1,49.1,0.3,63,20.4c14,20.3,12.8,47.6-2.6,66.3%20c-16,19.3-42.9,26.1-65.9,14.1c-9.7-5.1-15.1-2.6-22.3,2.9c-21.1,16.2-71.7,59.9-73.4,68.6c-5.8,28.5,11.3,41.3,31,54.3%20c14.1,9.4,27.4,20,40.6,30.7c8.1,6.6,14.9,8.8,25.6,3.5c22.8-11.3,48-4.7,64.2,14.5c14.9,17.6,16.9,43.6,4.9,63.4%20c-12.7,21-37.4,30.9-61.6,24.7c-26.6-6.9-43.5-31.6-39.3-61.1c1.5-10.9-1.6-16.3-9.8-22.1c-21.6-15.4-42.8-31.5-63.8-47.7%20c-7-5.4-12.2-6.7-21-2.3c-24.1,11.9-51.3,5-67.3-15.1c-15.4-19.4-15.5-48.3-0.1-67.8c16.1-20.4,42.5-27.1,67-15.3%20c8.6,4.1,13.9,3.4,21.1-2.2c20-15.7,40.6-30.6,61-45.9C226.8,96.9,230.9,87.8,230,76.4L230,76.4z'/%3e%3c/svg%3e)
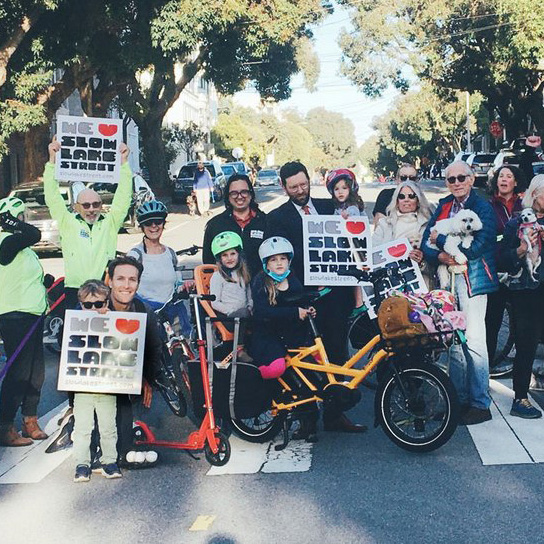
On December 6th, 2022, the SFMTA Board of Directors, after a marathon 8 hour public comment session, unanimously approved 16 residential streets to become the foundation of a citywide Slow Streets network. To prepare for this hearing, we analyzed crash data from the Department of Public Health to understand the impact these Slow Streets had on public safety throughout a 2 year pilot program.
In 2022, the 14 streets that participated in the pilot program collectively reduced vehicle crashes on them by 61% compared to just a 20% drop in crashes citywide. Now, two years later, we've updated our analysis to also include the impact Slow Streets have had on emergency response times.
This project is a live dashboard and map that is updated daily with the latest vehicle crash and emergency response data from the City of San Francisco.
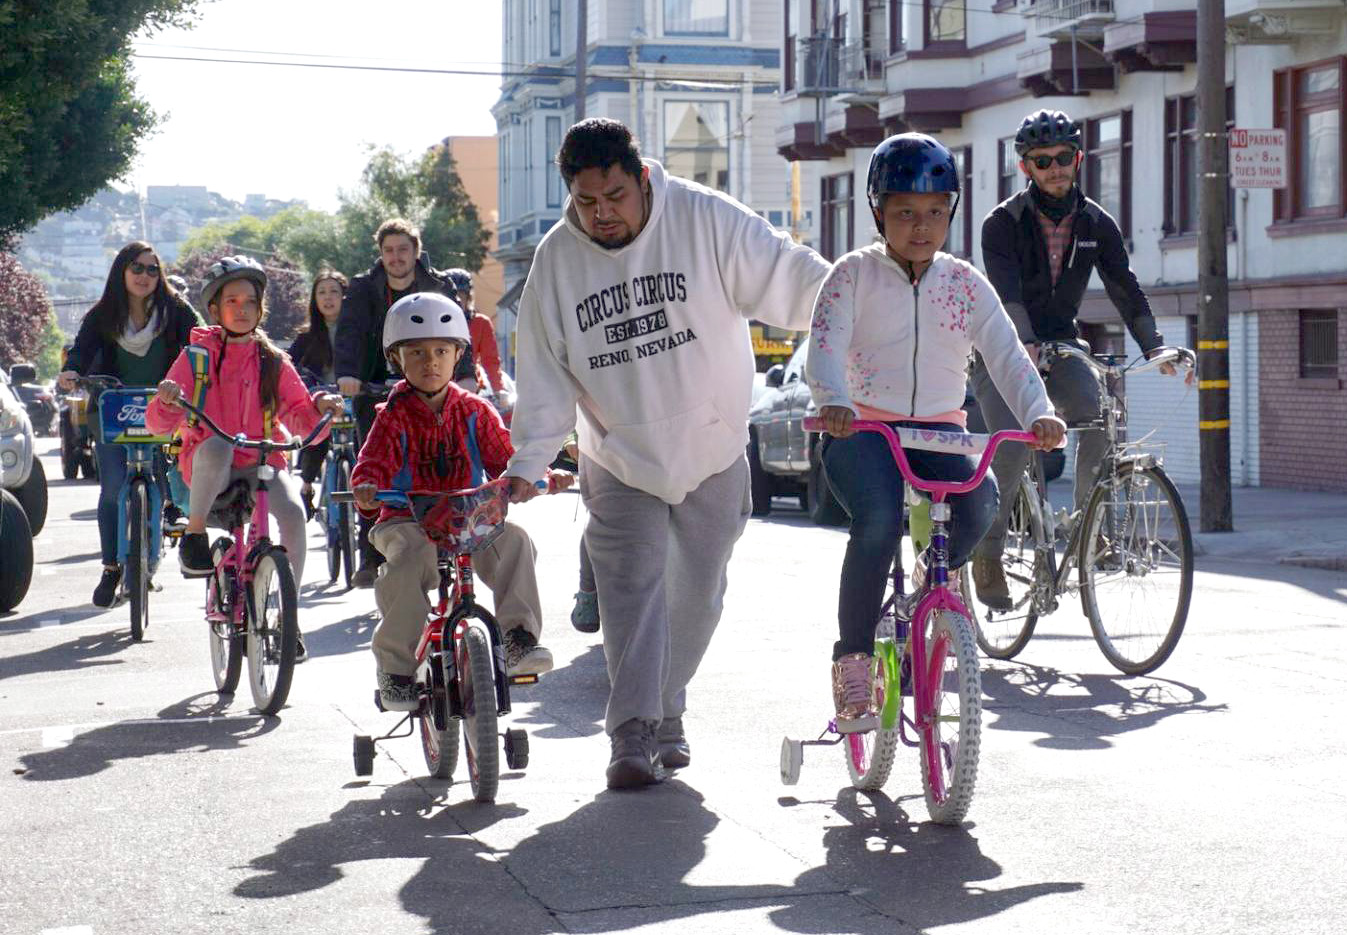

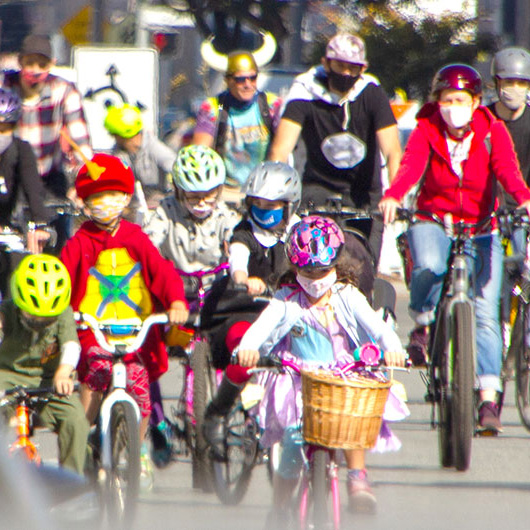
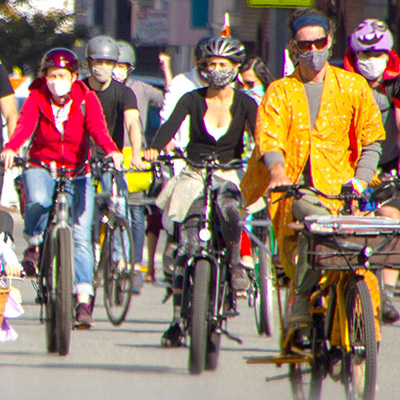
Slow Streets Could Be an Answer
San Francisco Slow Streets
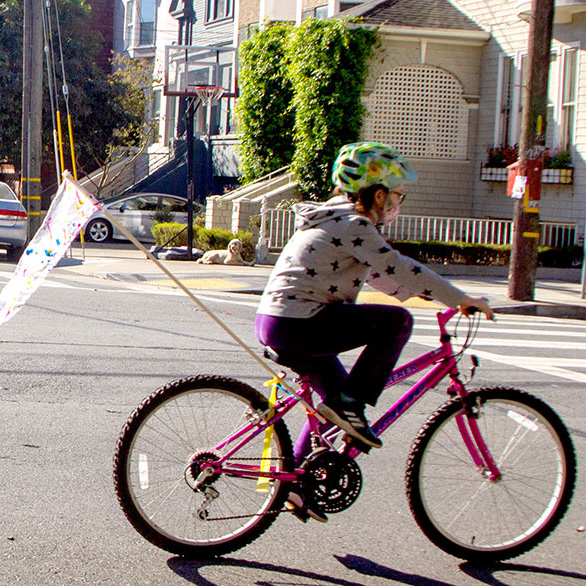
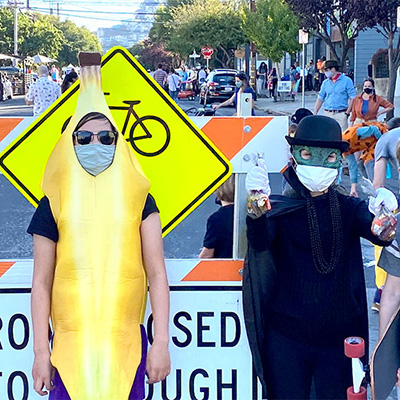
San Francisco currently has 18 Slow Streets, which are all on quiet, residential streets where vehicle through traffic is gently discouraged via soft-hit posts at intersections. These posts attempt to limit vehicle through traffic to no more than a 1,000 vehicles per day at an average speed of 15 MPH. To ensure this is happening, residents on several Slow Streets have purchased and installed Telraam sensors that track daily vehicle volume and speed. Our live analysis of Telraam's sensor data shows how Slow Streets with Telraam sensors are currently tracking against SFMTA's threshold of 1,000 vehicles per day at 15 MPH.
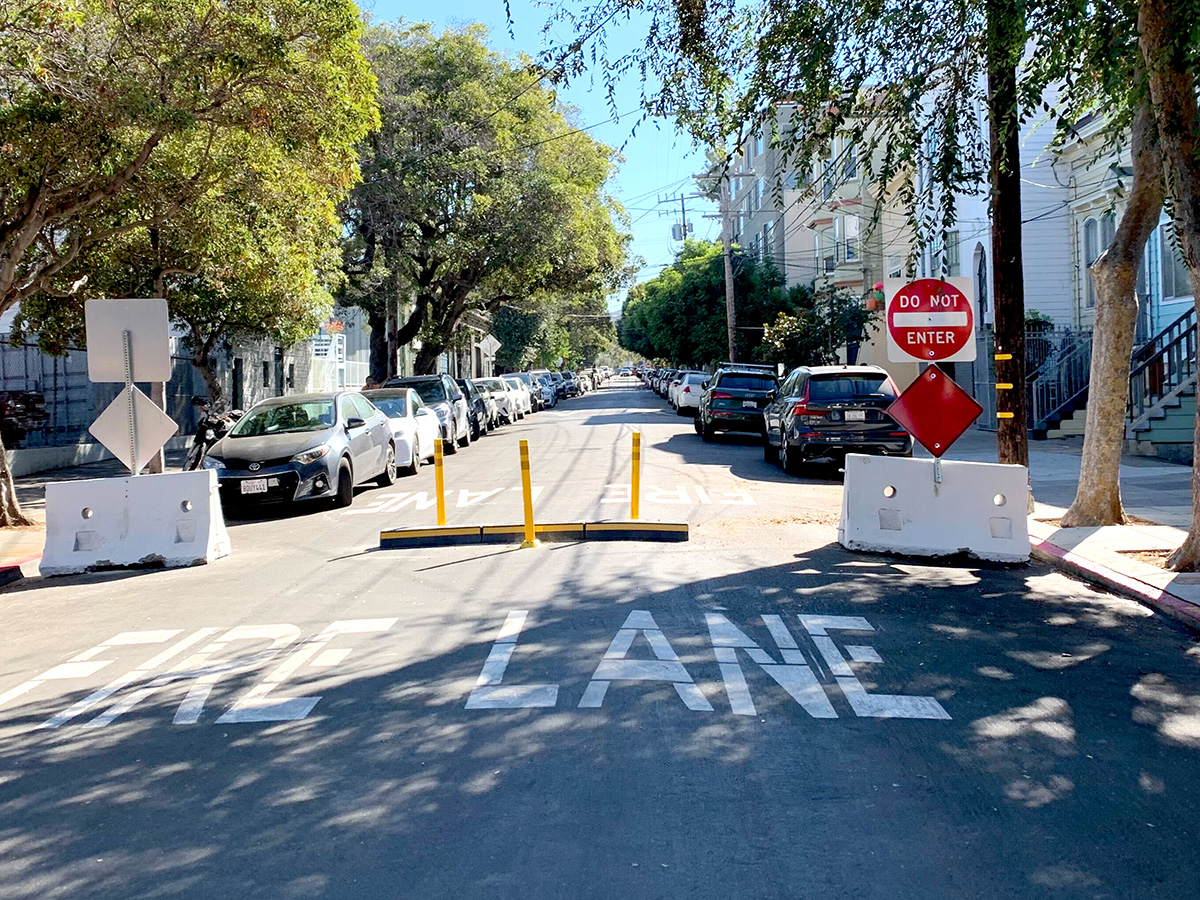
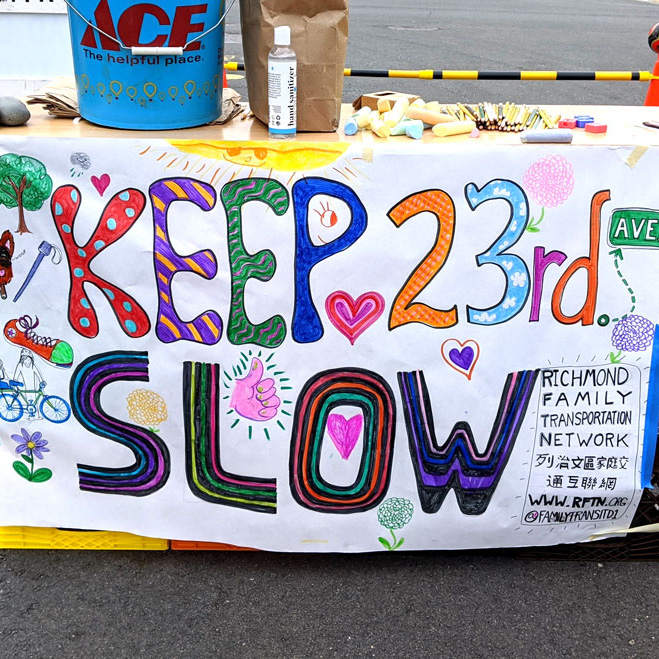
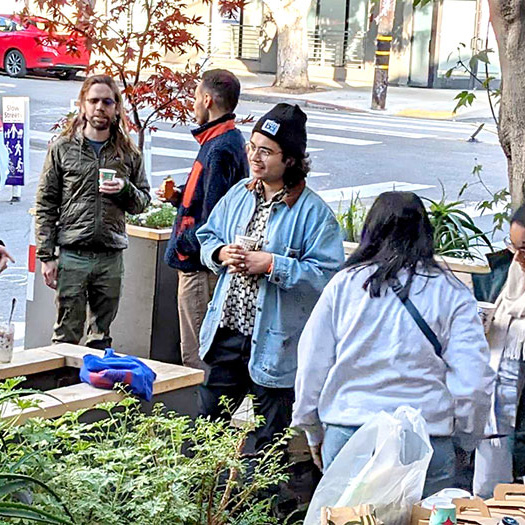
The most successful Slow Streets have modal filters at major intersections or mid-block "pan bashers" that attempt to prevent unnecessary vehicle through traffic. These simple, inexpensive traffic calming measures have significantly reduced vehicle crashes on Page Street and Shotwell Street.
%20--%3e%3csvg%20version='1.1'%20id='Layer_1'%20xmlns='http://www.w3.org/2000/svg'%20xmlns:xlink='http://www.w3.org/1999/xlink'%20x='0px'%20y='0px'%20viewBox='0%200%20400%20400'%20style='enable-background:new%200%200%20400%20400;'%20xml:space='preserve'%3e%3cstyle%20type='text/css'%3e%20.st0{fill:%23FFFFFF;}%20%3c/style%3e%3cpath%20class='st0'%20d='M15.2,99.6c-4.4,4.4-6.8,10.3-6.8,16.5s2.5,12.1,6.8,16.5l169.2,169.2c4.4,4.4,10.3,6.8,16.5,6.8%20s12.1-2.5,16.5-6.8l169.2-169.2c5.9-5.9,8.2-14.5,6-22.6s-8.5-14.3-16.5-16.5c-8.1-2.2-16.7,0.1-22.6,6L200.8,252.3L48.2,99.6%20c-4.4-4.4-10.3-6.8-16.5-6.8C25.5,92.8,19.5,95.2,15.2,99.6L15.2,99.6z'/%3e%3c/svg%3e)
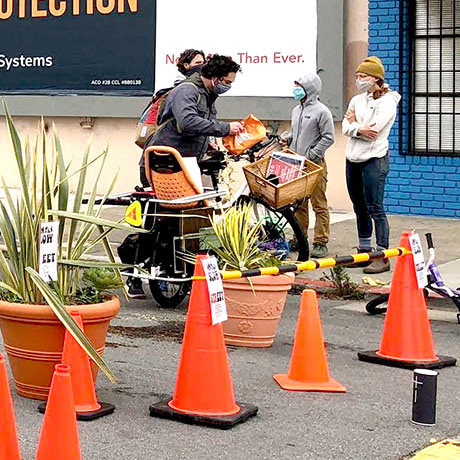
Soft hit posts to discourage vehicle through traffic were first installed at intersections on Page Street in April 2020 and Page Street officially became a Slow Street in January 2023.
In the 75 months since soft hit posts were first installed, Page Street has experienced a -51.72% decrease in vehicle crashes and a 10.37% increase in emergency response times compared to the 75 months prior.
%20--%3e%3csvg%20version='1.1'%20id='Layer_1'%20xmlns='http://www.w3.org/2000/svg'%20xmlns:xlink='http://www.w3.org/1999/xlink'%20x='0px'%20y='0px'%20viewBox='0%200%20400%20400'%20style='enable-background:new%200%200%20400%20400;'%20xml:space='preserve'%3e%3cg%3e%3cpath%20d='M46.8,301.9c-7.5,0-13.4-5.9-13.4-13.4V134.8h291.5v78.8l21.7,5.9V69.8c0-19.3-15.8-35.1-35.1-35.1H46.8%20c-19.3,0-35.1,15.8-35.1,35.1V288c0,19.3,15.8,35.1,35.1,35.1h195.4l-5.9-21.7H46.8V301.9z%20M243,74.2h57.1%20c5.9,0,10.6,4.7,10.6,10.6s-4.7,10.6-10.6,10.6H243c-5.9,0-10.6-4.7-10.6-10.6C231.9,78.9,237,74.2,243,74.2z%20M123.6,74.2h2%20c5.9,0,10.6,4.7,10.6,10.6s-4.7,10.6-10.6,10.6h-2c-5.9,0-10.6-4.7-10.6-10.6C112.6,78.9,117.3,74.2,123.6,74.2z%20M90.9,74.2h2%20c5.9,0,10.6,4.7,10.6,10.6s-4.7,10.6-10.6,10.6h-2c-5.9,0-10.6-4.7-10.6-10.6C79.9,78.9,85,74.2,90.9,74.2z%20M58.2,74.2h2%20c5.9,0,10.6,4.7,10.6,10.6s-4.7,10.6-10.6,10.6h-2c-5.9,0-10.6-4.7-10.6-10.6C47.2,78.9,52.3,74.2,58.2,74.2z'/%3e%3cpath%20d='M382.4,326.3l-44.1-44.1l22.1-16.5c8.3-5.9,5.5-18.9-4.3-21.7l-101.2-27.2c-9.1-2.4-17.3,5.9-15,15L267,333%20c2.8,9.8,15.4,12.2,21.7,4.3l16.5-22.1l44.1,44.1c4.7,4.7,12.6,4.7,17.3,0l16.2-16.2C387.1,338.9,387.1,331,382.4,326.3z'/%3e%3cpath%20d='M78.7,186h59.9c5.9,0,10.6-4.7,10.6-10.6c0-5.9-4.7-10.6-10.6-10.6H78.7c-5.9,0-10.6,4.7-10.6,10.6%20C68,181.3,72.8,186,78.7,186z'/%3e%3cpath%20d='M203.2,218.3c0-5.9-4.7-10.6-10.6-10.6H78.7c-5.9,0-10.6,4.7-10.6,10.6c0,5.9,4.7,10.6,10.6,10.6h113.8%20C198,229,203.2,224.3,203.2,218.3z'/%3e%3cpath%20d='M78.7,250.7c-5.9,0-10.6,4.7-10.6,10.6s4.7,10.6,10.6,10.6h83.1c5.9,0,10.6-4.7,10.6-10.6s-4.7-10.6-10.6-10.6%20C161.8,250.7,78.7,250.7,78.7,250.7z'/%3e%3c/g%3e%3c/svg%3e)
Vehicle Crashes Resulting in Injuries
%20--%3e%3csvg%20version='1.1'%20id='Layer_1'%20xmlns='http://www.w3.org/2000/svg'%20xmlns:xlink='http://www.w3.org/1999/xlink'%20x='0px'%20y='0px'%20viewBox='0%200%20400%20400'%20style='enable-background:new%200%200%20400%20400;'%20xml:space='preserve'%3e%3cstyle%20type='text/css'%3e%20.st0{fill-rule:evenodd;clip-rule:evenodd;}%20%3c/style%3e%3cpath%20class='st0'%20d='M120.7,49c4.1-0.2,7.7,2.3,9.1,6.1l17.9,44.8l46.2-14l0,0c3.8-1.2,8,0.1,10.5,3.3l0.7,1.1%20c-10.6,5.1-19.7,12.9-26.3,22.5l-25,35.8c-17.2,5.5-30.4,19.4-35.1,36.9l-12.2,45L85,250.2c-3,2.6-7.2,3.3-10.8,1.6%20c-3.6-1.7-5.8-5.5-5.5-9.4l3.5-47.9l-47.9-7.6c-3.9-0.5-7.1-3.5-8-7.4c-0.8-3.9,0.7-7.9,4-10.2L60,141.9l-24-41.8l0,0%20c-2.1-3.4-1.7-7.8,0.8-10.8c2.4-3.2,6.6-4.5,10.4-3.3l46.5,14l17.9-44.8C113,51.3,116.7,48.8,120.7,49L120.7,49z%20M247.3,104.7%20l82.5,21.5l0,0c19.8,5.6,34,22.9,35.9,43.4l4.2,50.7c10.8,8.4,15.6,22.4,12,35.6l-21.7,79.7c-3.1,10.1-13.5,16.1-23.8,13.7l-9.4-2.5%20c-10.3-2.8-16.5-13.4-13.8-23.8l5.1-18.8L168,264l-5,18.8l0,0c-2.9,10.2-13.5,16.3-23.8,13.7l-9.4-2.5l0,0c-5-1.3-9.2-4.5-11.8-9%20c-2.6-4.5-3.3-9.8-1.9-14.7l21.4-79.4c3.5-13.3,14.6-23.3,28.3-25.1l29.1-42C206.5,107.1,227.5,99.4,247.3,104.7L247.3,104.7z%20M237.2,142c-4-1-8.1,0.5-10.5,3.8L207.1,174l122.6,32.8l-2.8-34.8c-0.5-3.9-3.3-7.1-7.2-8.1L237.2,142z%20M176.8,231.3%20c3.7,1.1,7.7,0.6,11.1-1.4c3.4-1.9,5.9-5.1,6.9-8.8s0.5-7.7-1.5-11.1c-1.9-3.4-5.2-5.8-8.9-6.8c-3.7-1.1-7.7-0.6-11.1,1.3%20c-3.4,1.9-5.8,5.1-6.9,8.9c-1,3.7-0.5,7.7,1.5,11.1C169.8,227.9,173,230.4,176.8,231.3L176.8,231.3z%20M334.8,243.4%20c-7.8-2.1-15.8,2.6-17.8,10.4c-2.1,7.8,2.6,15.8,10.4,17.8c7.8,2.1,15.8-2.6,17.8-10.4C347.2,253.4,342.6,245.5,334.8,243.4z'/%3e%3c/svg%3e)
| Location | before 04/01/2020 | after 04/01/2020 | percent change |
|---|---|---|---|
| Page Street | 58 | 28 | -51.72% |
| San Francisco | 25,014 | 21,432 | -14.32% |
Average Emergency Response Times
%20--%3e%3csvg%20version='1.1'%20id='Layer_1'%20xmlns='http://www.w3.org/2000/svg'%20xmlns:xlink='http://www.w3.org/1999/xlink'%20x='0px'%20y='0px'%20viewBox='0%200%20400%20400'%20style='enable-background:new%200%200%20400%20400;'%20xml:space='preserve'%3e%3cpath%20d='M345.9,96.8c0.4-2.8-2-5.2-4.8-5.2c-1.2,0-2.4,0.4-3.2,0.8L291,126.8c-5.6-6.8-11.6-12.8-18.4-18.4L307,61.6%20c1.2-1.6,1.2-3.6,0.4-5.2c-0.8-1.6-2.8-2.8-4.8-2.4c-15.6,0-30.8-4.8-43.6-14c-24.4-17.2-38-25.6-59.2-25.6s-34.8,8-59.2,25.2%20c-12.8,9.2-28,14-43.6,14c-2,0-3.6,0.8-4.8,2.4c-0.8,1.6-0.8,3.6,0.4,5.2L127,108c-6.8,5.6-12.8,11.6-18.4,18.4L61.7,92%20c-2.4-1.6-5.2-1.2-7.2,0.8c-0.8,0.8-1.2,2-0.8,3.2c0,15.6-4.8,30.8-14,43.6c-16.8,25.2-24.8,38.8-24.8,60s8,34.8,25.2,59.2%20c9.2,12.8,14,28,14,43.6c-0.4,2.8,1.6,5.2,4.4,5.2c1.2,0,2.4-0.4,3.2-0.8l46.8-34.4c5.2,6.8,11.6,12.8,18.4,18.4l-34.4,46.8%20c-1.6,2.4-1.2,5.2,0.8,7.2c0.8,0.8,2,1.2,3.2,0.8c15.6,0,30.8,4.8,43.6,14c24.4,17.2,38,25.2,59.2,25.2s34.8-8,59.2-25.2%20c12.8-9.2,28-14,43.6-14c2.8,0.4,5.2-2,5.2-4.8c0-1.2-0.4-2.4-0.8-3.2l-34.4-46.8c6.8-5.2,12.8-11.6,18.4-18.4l46.8,34.4%20c0.8,0.8,2,0.8,2.8,0.8s1.6-0.4,2.4-0.8c1.6-0.8,2.8-2.8,2.8-4.8c0-15.6,4.8-30.8,14-43.6c17.2-24.4,25.2-38,25.2-59.2%20s-8-34.8-25.2-59.2C350.7,127.6,345.9,112.4,345.9,96.8z%20M199.8,306.5c-58.8,0-106.9-47.6-106.9-106.9S141,92.8,199.8,92.8%20s106.9,48,106.9,106.9S258.6,306.5,199.8,306.5z'/%3e%3cpath%20d='M236.2,149.6c-2.4-1.2-5.6-0.4-6.8,2c-0.8,1.2-0.8,2.4-0.4,3.6c5.6,19.2,3.2,27.2-0.8,34.4c-20-22.4,0-70.8,0.4-71.2%20c0.8-1.6,0.4-3.6-0.8-5.2s-3.2-2-5.2-1.6c-0.8,0-66,17.6-66,81.2c-4.8-7.2-6.4-16-5.6-24.4c0.4-2.8-1.6-5.2-4.4-5.6%20c-2-0.4-4,0.8-4.8,2.8c-1.2,2.4-28.8,56-8.8,90.9c10,17.2,30,26.4,58.8,27.2h5.2c30.8,0,52.8-8.8,65.2-25.6%20c15.6-22,10.8-52,5.6-66.4C257,161.2,237,150,236.2,149.6z'/%3e%3c/svg%3e)
| Location | before 04/01/2020 | after 04/01/2020 | percent change |
|---|---|---|---|
| Page Street | 3:27 | 3:48 | 10.37% |
| San Francisco | 4:17 | 4:45 | 10.79% |
About Emergency Response Times
The response time of an emergency is the amount of time it takes for the fire department to get from its responding station to the scene of the emergency. These moments in time are noted on the map as "unit departed" and "arrived on scene" respectively. The average response time for a Slow Street is calculated by simply adding these response times together and dividing by the total number of emergencies.
However, it's important to note that some streets have had a few emergencies with very long response times that sharply skew its average. These are outliers that do not appear to be caused by any changes that were made to the Slow Street and warrant further investigation via a public records request. To view these outliers, filter a street's emergencies on the map to show response times that were greater than 15 minutes. If you'd like to help us investigate the reason for these outliers, please support our work.
The chart below shows how emergency response times to a Slow Street compare to the citywide average over time. Slow Streets are low volume, residential streets that typically have far fewer emergencies than busy arterials and during some months may have had no emergencies at all. Months without any emergencies are represented by a break in the line graph. Tap on any point to view the number of emergencies for a month and its average response time.
At this time, we are only able to show emergencies from 2018 through the present due to the cost of hosting millions of 911 calls on our servers. You may however view vehicle crashes for an equal amount of time pre vs post Slow Street by selecting vehicle crashes from the dropdown menu.
Mapping Crashes & Emergencies on Page Street
The map below shows vehicle crashes and emergencies on Page Street. You can select a different street on the map or via the dropdown menu, filter crashes and emergencies by several attributes and view the street on Google Street View. It's important to note that not all calls to 911 are determined to be emergencies by the dispatch operators. 911 calls that are determined to be non-emergencies typically have significantly higher response times than emergencies for obvious reasons.
There are many factors that influence the fire department's response time to an emergency, such as the route taken and any vehicle traffic encountered along the way. It's important to keep this in mind while evaluating emergency response times to any Slow Street.
%20--%3e%3csvg%20version='1.1'%20id='Layer_1'%20xmlns='http://www.w3.org/2000/svg'%20xmlns:xlink='http://www.w3.org/1999/xlink'%20x='0px'%20y='0px'%20viewBox='0%200%20400%20400'%20style='enable-background:new%200%200%20400%20400;'%20xml:space='preserve'%3e%3cstyle%20type='text/css'%3e%20.st0{fill-rule:evenodd;clip-rule:evenodd;fill:%23FFFFFF;}%20%3c/style%3e%3cpath%20class='st0'%20d='M13.1,225v-50.5c0-12.9,10.5-23.3,23.8-23.3h114.4V36.8c0-13.3,10.5-23.8,23.3-23.8h50.5%20c13.3,0,23.8,10.5,23.8,23.8v114.4h114.4c12.9,0,23.8,10.5,23.8,23.3V225c0,13.3-11,23.8-23.8,23.8H249v114.4%20c0,12.9-10.5,23.8-23.8,23.8h-50.5c-12.9,0-23.3-11-23.3-23.8V248.9H37C23.6,248.9,13.1,238.4,13.1,225L13.1,225z'/%3e%3c/svg%3e)
%20--%3e%3csvg%20version='1.1'%20id='Layer_1'%20xmlns='http://www.w3.org/2000/svg'%20xmlns:xlink='http://www.w3.org/1999/xlink'%20x='0px'%20y='0px'%20viewBox='0%200%20400%20400'%20style='enable-background:new%200%200%20400%20400;'%20xml:space='preserve'%3e%3cstyle%20type='text/css'%3e%20.st0{fill-rule:evenodd;clip-rule:evenodd;fill:%23FFFFFF;}%20%3c/style%3e%3cpath%20class='st0'%20d='M250.3,248.9H37c-13.3,0-23.8-10.5-23.8-23.8l0,0v-50.5c0-12.9,10.5-23.3,23.8-23.3h213.4'/%3e%3cpath%20class='st0'%20d='M249,151.2h114.4c12.9,0,23.8,10.5,23.8,23.3V225c0,13.3-11,23.8-23.8,23.8H249'/%3e%3c/svg%3e)
%20--%3e%3csvg%20version='1.1'%20id='Layer_1'%20xmlns='http://www.w3.org/2000/svg'%20xmlns:xlink='http://www.w3.org/1999/xlink'%20x='0px'%20y='0px'%20viewBox='0%200%20400%20400'%20style='enable-background:new%200%200%20400%20400;'%20xml:space='preserve'%3e%3cstyle%20type='text/css'%3e%20.st0{fill:%23FFFFFF;}%20%3c/style%3e%3cpath%20class='st0'%20d='M140.9,68.4V56.7c0-4.8-3.9-8.7-8.7-8.7h-56c-4.8,0-8.7,3.9-8.7,8.7v11.7H30.1V99h37.4v13.8%20c0,4.8,3.9,8.7,8.7,8.7h56c4.8,0,8.7-3.9,8.7-8.7V99h229.3V68.4H140.9z%20M236.9,171.5c0-4.8-3.9-8.7-8.7-8.7h-56%20c-4.8,0-8.7,3.9-8.7,8.7v12.7H30.1v30.5h133.3v12.7c0,4.8,3.9,8.7,8.7,8.7h56c4.8,0,8.7-3.9,8.7-8.7v-12.7h133.3v-30.5H236.9V171.5z%20M332.8,287.3c0-4.8-3.9-8.7-8.7-8.7h-56c-4.8,0-8.7,3.9-8.7,8.7V300H30.1v30.5h229.3v12.7c0,4.8,3.9,8.7,8.7,8.7h56%20c4.8,0,8.7-3.9,8.7-8.7v-12.7h37.4V300h-37.4V287.3z'/%3e%3c/svg%3e)
%20--%3e%3csvg%20version='1.1'%20id='Layer_1'%20xmlns='http://www.w3.org/2000/svg'%20xmlns:xlink='http://www.w3.org/1999/xlink'%20x='0px'%20y='0px'%20viewBox='0%200%20400%20400'%20style='enable-background:new%200%200%20400%20400;'%20xml:space='preserve'%3e%3cstyle%20type='text/css'%3e%20.st0{fill:%23FFFFFF;}%20%3c/style%3e%3cpath%20class='st0'%20d='M260.7,214.6c-2.5,2.5-5.1,5.1-8.1,7.1v58.7c0,17.7-14.2,31.9-31.9,31.9h-41c-17.7,0-31.9-14.2-31.9-31.9v-58.7%20c-3-2-6.1-4.1-8.1-7.1c-55.2,11.1-94.2,37-94.2,67.4c0,33.4,47.1,61.3,111.4,70.4l43.6,33.9l43.6-33.9c64.3-9.1,111.4-37,111.4-70.4%20C354.9,252,315.9,226.2,260.7,214.6L260.7,214.6z'/%3e%3cpath%20class='st0'%20d='M234.4,47.4c0,19-15.4,34.4-34.4,34.4s-34.4-15.4-34.4-34.4S180.9,13,200,13S234.4,28.4,234.4,47.4'/%3e%3cpath%20class='st0'%20d='M158.9,218.1v62.3c0,11.1,9.1,20.3,20.3,20.3l41,0c11.1,0,20.3-9.1,20.3-20.3l0-62.3c0-2.5,1.5-4.6,3.5-5.6%20c7.6-3,12.7-10.6,12.7-18.7l0-72.9c0-11.1-9.1-20.3-20.3-20.3l-72.9,0c-11.1,0-20.3,9.1-20.3,20.3v72.9c0,8.1,5.1,15.7,12.7,18.7%20C157.9,213.6,158.9,215.6,158.9,218.1L158.9,218.1z'/%3e%3c/svg%3e)
Before & After: Slow Streets vs San Francisco
The table below shows the number of vehicle crashes and the average emergency response time to each street before and after it became a Slow Street. San Francisco's 18 Slow Streets have collectively experienced 319 vehicle crashes before traffic calming measures were installed on them and 142 vehicle crashes since then. In the 43 months since the Slow Streets program was officially approved on December 6th, 2022, San Francisco has experienced 10,373 vehicle crashes citywide compared to 9,925 during the previous 43 months. This equates to a 55.49% decrease in vehicle crashes on San Francisco's Slow Streets compared to a 4.51% increase in vehicle crashes citywide over the same time period.
The average emergency response time to all Slow Streets was 3:47 prior to December 6th, 2022 and is currently 4:22. The average emergency response time across San Francisco prior to the implementation of the Slow Streets program was 4:28 and is currently 4:51. This equates to a 15.37% increase in emergency response times to San Francisco's Slow Streets compared to a 8.37% increase in emergency response times citywide.
Despite the nominal increase in emergency response times to San Francisco's Slow Streets, it is clear the program has been a phenomenal success as it has reduced vehicle crashes across its 18 streets by 55.49%. This data should embolden the San Francisco Municipal Transportation Agency to expand the Slow Streets program as quickly as possible to encourage more people to walk, bike and scoot across the city by significantly reducing the chance that they will be killed by a motor vehicle while doing so.
| Street Name | Pre-Slow Street | Post-Slow Street | Percent Change |
|---|---|---|---|
| 12th Avenue | 6 | 0 | -100.00% |
| 20th Street | 16 | 17 | 6.25% |
| 23rd Avenue | 10 | 4 | -60.00% |
| Arlington Street | 1 | 0 | -100.00% |
| Cabrillo Street | 45 | 12 | -73.33% |
| Cayuga Avenue | 21 | 9 | -57.14% |
| Clay Street | 11 | 15 | 36.36% |
| Golden Gate Avenue | 18 | 8 | -55.56% |
| Hearst Avenue | 0 | 1 | 100.00% |
| Lake Street | 52 | 13 | -75.00% |
| Lyon Street | 15 | 2 | -86.67% |
| Minnesota Street | 10 | 5 | -50.00% |
| Noe Street | 7 | 3 | -57.14% |
| Page Street | 58 | 28 | -51.72% |
| Sanchez Street | 9 | 3 | -66.67% |
| Shotwell Street | 36 | 16 | -55.56% |
| SoMa Slow Streets | 2 | 1 | -50.00% |
| Somerset Street | 2 | 5 | 150.00% |
About This Project
This project was designed and developed by Stephen Braitsch with editorial support from Beaudry Kock. We thank the following safe street advocates & community organizers for their help analyzing and contextualizing the data: Alec Hawley, Andrew Casteel, Dave Alexander, Donovan Lacy, Emily Huston, Frank Tizedes, Jess Jenkins, John Elliot, Joseph Tartakovsky, Laura Skelton, Molly Hayden, Peter Belden, Parker Day, Robin Kutner, Sara Barz, Scott Feeney, Tiffany Delloue, Tim Hickey and Trish Gump.
The crash data used in this analysis is sourced from the San Francisco Department of Public Health who publish new crash data every three months. The most recent crash data available is through May 31st, 2026. 911 emergency data is sourced from the San Francisco Fire Department and is updated daily.