Ocean Beach Park
An Analysis of the Economic & Public Safety Impacts of
Converting San Francisco's Great Highway into an Oceanfront Park
An Analysis of the Economic & Public Safety Impacts of Converting San Francisco's Great Highway into an Oceanfront Park
October 2024
Introduction

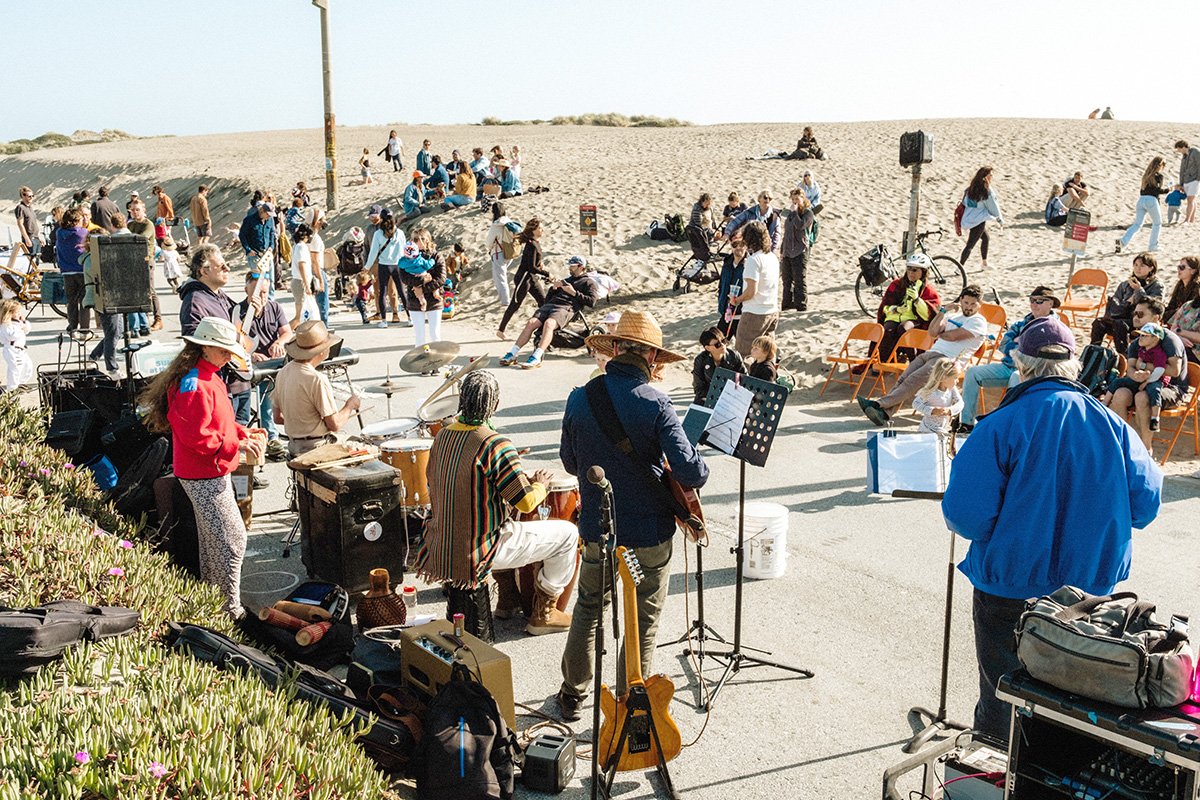
On November 5th, San Francisco voters will decide whether to continue allowing vehicle traffic on the Great Highway or to convert the 2 mile, oceanfront roadway into a public park.

In April 2020, at the height of the pandemic, San Francisco Mayor London Breed and then District 4 Supervisor Gordon Mar ordered the Great Highway closed to vehicle traffic to give local residents a safe, open space to recreate. In August 2021, as the pandemic began to abate and people started returning to work, the Great Highway was reopened to vehicle traffic from Monday at 6am to Friday at 12pm while remaining a car-free space throughout the weekend as a compromise between those who want to drive on it and those who want it to remain a recreational space. This arrangement continues to this day and is set to expire at the end of 2025.

In June 2024, Westside supervisors Joel Engardio and Myrna Melgar introduced Proposition K, a ballot measure to convert the Great Highway into a permanent, public park by prohibiting private vehicles on it. District 4 Supervisor Joel Engardio shares his reasoning for converting the roadway into a park, his plan to mitigate traffic concerns throughout the neighborhood and the political landscape surrounding the conversation.

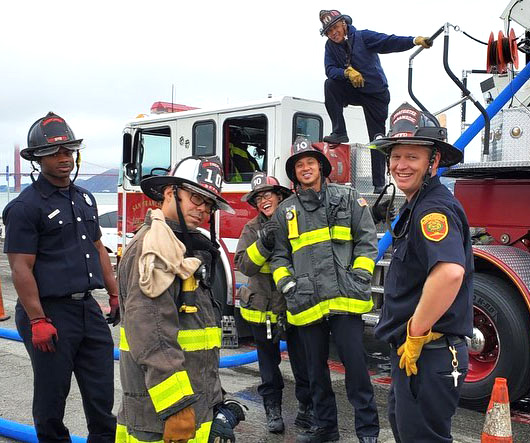
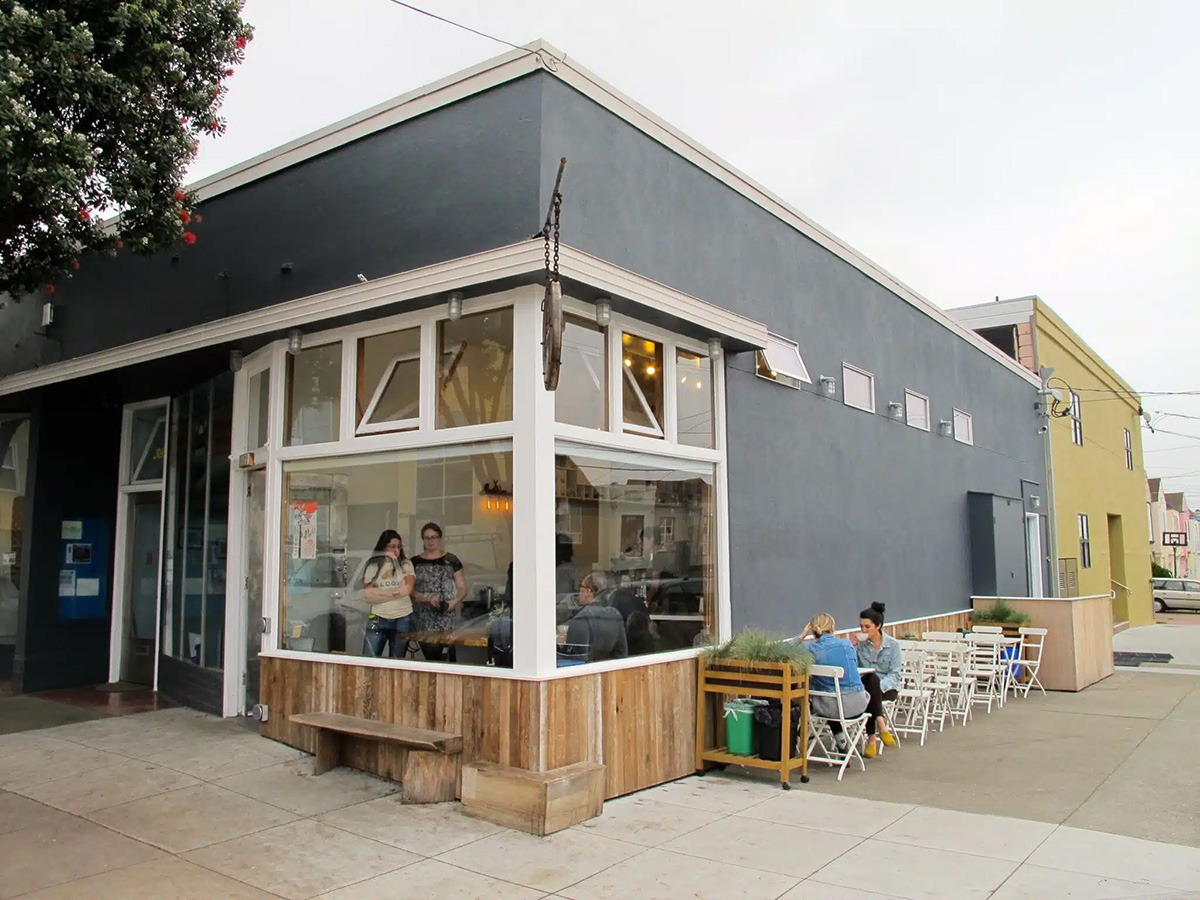
This project identifies the likely economic and public safety impacts of converting the Great Highway into a public park by analyzing vehicle crash and 911 data as well as eight case studies that underwent similar transformations from a roadway or industrial area to a public park.

The
Neighborhood
The Sunset and Parkside neighborhoods, colloquially known as "The Sunset District", are located on the western edge of San Francisco adjacent to the Pacific Ocean and Golden Gate Park.

The Sunset District represents approximately 10% of the area of San Francisco and 9% of its population. The neighborhood is predominately Asian (52.54%) and White (30.45%). 16.30% of residents are children under age 18 and 20.98% of residents are seniors over age 65.

Prior to the residential and commercial development of the Sunset District, much of the area was covered by sand dunes and was originally referred to by 19th century San Franciscans as the "Outside Lands".

Today it is home to a diverse collection of boutique retail shops and eclectic restaurants along Taraval, Noriega and Judah Streets and Ocean Beach is a popular destination for surfing and watching the sunset for which the district gets its name.

Sunset / Parkside vs San Francisco
Sunset / Parkside
San Francisco
Our
Projections
On annual visitation, additional spending at local businesses and public safety.

To project the impacts of converting the Great Highway into an oceanfront park on the local economy and public safety, we analyzed current visitation on the weekends when the Great Highway is closed to vehicles, vehicle crashes and 911 emergency response times across the neighborhood since the pilot program began as well as eight case studies that underwent similar transformations from a roadway or industrial area to a public park.

We can conclusively and confidently say that converting the Great Highway into an oceanfront park will have a signficant positive impact on public safety, the local businesses community and over time, the City of San Francisco's tax base.

Learn how we arrived at our projections
Annual Visitation
Projection: 768,560 – 1.3M Visitors
Projection
768,560 – 1.3M Visitors
Annual visitation will be greatly influenced by what San Francisco ultimately decides to do with the Great Highway if it is converted into a park.

However, to project a range, we looked at how many people are visiting the Great Highway today when it is closed to vehicles on the weekend to generate a low-end estimate alongside the annual visitation trends of a variety of San Francisco parks to generate a high-end estimate.

Projecting Weekly Visitation Based On Current Weekend Visitation

The San Francisco Recreation and Park Department estimates that 4,000 people currently visit the Great Highway every Saturday and Sunday and 1,356 visit on Fridays after 12pm. This gives us an average of 9,356 weekend visitors when the Great Highway is closed to vehicles.

If we use Friday’s average of 1,356 visitors for Monday through Thursday, when the Great Highway is open to vehicles, we can project an average of 14,780 weekly visitors or 768,560 visitors per year if the Great Highway is closed to vehicles every day of the week. This does not account for visitors on Mondays before 6am, for which no data is available, so we’ll use this as our low-end, baseline estimate.

Rec and Park also estimates that there were 141,700 weekend visits between January 1st and March 31st, 2024 which breaks down to 10,900 visitors per weekend (141,700 visitors / 13 weekends). If we subtract 1,356 Friday visitors from 10,900 total weekend visitors, we get 9,544 visitors on Saturdays and Sundays. 1,356 x 5 weekdays + 9,544 visitors on Saturdays and Sundays gives us a projection of 16,324 weekly visitors or 848,848 annual visitors if the Great Highway is closed to vehicles every day of the week. This is about 80K more visitors annually than our more conservative projection that uses 4,000 visitors for Saturdays and Sundays and suggests that weekend visitation is trending higher as these estimates are during the colder months of the year and when the days are shortest.

9,356
Current Weekend Visitation
(Temporary Pilot)
14,780
Estimated Weekly Visitation
(Temporary Pilot)
768,560
Estimated Annual Visitation
(Temporary Pilot)
Projecting Annual Visitation Based on San Francisco Park Attendance

To project visitation if the Great Highway is converted into a full-time park, we looked at the current annual visitation of a variety of parks across San Francisco and calculated their "visitors per square acre" (VPSA) by dividing their physical footprint in acres by their annual number of visitors.

For example, Golden Gate Park, which covers approximately 1,017 acres and sees an estimated 24M annual visitors has a VPSA of 23,599 (24M / 1,017 acres). Crissy Field, which covers 100 acres and sees an estimated 1.2M annual visitors has a VPSA of 12,000. Mission Dolores Park, which covers just 16 acres and yet sees and an estimated 1.2M annual visitors has a VPSA of 75,000.

We calculated the VPSA of several San Francisco parks of varying sizes and annual visitors which resulted in an average VPSA of 36,866. If we multiply this average VPSA of 36,866 by Great Highway’s 36.11 acres, we can project 1.3M annual visitors to the Great Highway if it converted into a full-time park.

3,647
Projected Daily Visitation
(Permanent Park)
25,601
Projected Weekly Visitation
(Permanent Park)
1,331,231
Projected Annual Visitation
(Permanent Park)
A locally-owned business in the Sunset / Parkside neighborhood
Local
Businesses
Projection: $6.3M – $12.6M Annual Revenue
Projection
$6.3M – $12.6M
Annual Revenue
To project how converting the Great Highway into a park will impact businesses in the Sunset / Parkside neighborhood we estimated the number of current visitors who are likely making a purchase today and the number of new customers the neighborhood can expect based on our projection of 768,560 – 1.3M annual visitors.
A locally-owned business in the Sunset / Parkside neighborhood
Estimated Customers Based on Current Weekend Visitation

According to a traffic study conducted by the San Francisco Recreation and Park Department, the Great Highway saw 486,512 visitors in 2023 when it was closed to vehicles from Friday at 12pm through Monday at 6am. 486,512 visitors / 365 days in a year averages out to 1,333 visitors per day. Studies show that approximately 34% – 42% of people visiting an area where retail is present are likely to buy something and a 2014 survey found that 47% of visitors to the Indianapolis Cultural Trail made a purchase from a nearby business. Taking a conservative average of these, considering the relatively low density of retail near the Great Highway, we can reasonably assume that 30% of all people who visit the Great Highway will spend money at a nearby business. This results in 1,333 daily visitors x 0.3% = 400 daily visitors who are currently spending money at Sunset / Parkside businesses.

400
Current Daily Customers
$20 – $40
Assumed Average Spend Per Customer
$2.9M – $5.8M
Estimated Neighborhood Business Revenue (Annually)
Projected Customers if The Great Highway is Converted into a Park

If the Great Highway is converted into a park, we project it will attract 768,560 – 1.3M visitors to the neighborhood annually. For simplicity, let’s average this range to 1,049,896 annual visitors, or approximately 2,876 visitors per day. 2,876 daily visitors x 0.3% = 863 daily customers which is an increase of 115.75% over the current number of customers we estimate are making purchases at Sunset / Parkside businesses while visiting the Great Highway on the weekend when it is closed to vehicles.

If each of these 863 projected daily customers spends $10 in the neighborhood that would result in an additional $8,630 spent at local businesses daily or $3,149,950 per year.

863
Projected Daily Customers
$20 – $40
Assumed Average Spend Per Customer
$6.3M – $12.6M
Projected Neighborhood Business Revenue (Annually)
customer average
daily spend
additional neighborhood
annual revenue
$10
$3,149,950
$20
$6,299,900
$30
$9,449,850
$40
$12,599,800
$50
$15,749,750
About Sunset / Parkside Businesses

As of September 2024, there are 5,035 registered businesses operating in the Sunset / Parkside neighborhood. These businesses collectively generated $2,227,339 in sales tax revenue for San Francisco in 2023. Approximately 983 of the 5,035 businesses in neighborhood specialize in food services, retail or accommodations; groups we believe are the most likely to benefit from an increase of foot traffic to the neighborhood.

Since 2019, the neighborhood has seen 713 businesses in these three categories open and 541 close. This equates to an average growth of 31.79% for businesses specializing in food services, retail or accommodations year over year.

Sales Taxes Generated By Sunset / Parkside Businesses YOY
Food, Retail & Accommodation Businesses Opening vs Closing YOY
Explore Businesses Across the Neighborhood

The map below shows all businesses in the neighborhood that have registered as providing food services, retail or accommodations. Many of the businessess providing accommodations appear to be private residences offering short-term accommodations via platforms such as Airbnb.

Public Safety
There are two primary public safety concerns related to converting the Great Highway into an oceanfront park.

Vehicle Crashes

Some people have expressed concerns that rerouting vehicle traffic off of the Great Highway and onto Lincoln and Sloat Boulevards may push traffic into residential areas of the neighborhood which may increase the number of vehicle crashes.

Emergency Response Times

Some people have expressed concerns that any potential increase in vehicle traffic across the neighborhood may have a negative affect on emergency response times.

Emergency personnel responding to a water rescue on Ocean Beach in September 2024
Rate of Vehicle Crashes Since August 2021
Sunset / Parkside Neighborhood vs San Francisco
Sunset / Parkside
1 Crash Every 3.64 Days
10 hrs
30 hrs
50 hrs
70hrs
San Francisco
1 Crash Every 3.09 Hours
10 hrs
30 hrs
50 hrs
70hrs
Vehicle Crashes

To determine if closing the Great Highway to vehicles on the weekend has resulted in an increase in vehicle crashes across the neighborhood, we analyzed all vehicle crashes between August 1, 2021 (when the current weekend pilot program began) and July 31st, 2024, the date of the most recently available crash data from the San Francisco Department of Health.

Between August 1, 2021 and July 31st, 2024 there were 301 vehicle crashes in the Sunset / Parkside neighborhood. Of these, 104 occurred during the weekend pilot (between Friday at 12pm and Monday at 6am) and 197 occurred during the week when the Great Highway was open to vehicles.

To calculate the frequency of vehicle crashes on weekends vs during the week, we need to do a bit of math.

There are 168 hours in a week. The Great Highway is currently closed to vehicles for 66 hours (39.29%) of the week (Friday at 12pm through Monday at 6am) and open the remaining 102 hours, or 60.71% of the week.

There were 1,096 days between August 1, 2021 and July 31st, 2024. 1,096 days x 24 hours in a day equals 26,309 total hours. Of these 26,309 total hours, the Great Highway was closed to vehicles for 10,336 hours (39.29%) and open to vehicles for 15,973 hours (60.71%).

To calculate the frequency of vehicle crashes on weekends vs during the week, we divide the number of hours the roadway was open or closed to vehicles by the number of crashes that occurred during that time. As you can see in the table below, the vehicle crash frequency across the Sunset / Parkside neighborhood is currently slightly higher on weekdays when the Great Highway is open to vehicles compared to on weekends when it is not.

Rate of Vehicle Crashes Since August 2021
Sunset / Parkside Neighborhood (Weekdays vs Weekends)
Weekdays
Weekends
Total Hours
15,973
10,336
Total Crashes
197
104
1 Crash Every
81 Hours
99 Hours

This is somewhat surprising considering a June 2024 traffic study found that neighborhood streets experienced a lower average daily volume of vehicles on weekdays (7,713) compared to on the weekends (8,516), a difference of 10.43%. Plans to add traffic signals to Lincoln Boulevard and retime the traffic signals on Sunset and Sloat Boulevards as detailed in this blog post are expected to improve traffic flow and reduce vehicle crashes across the neighborhood.

Average Daily Vehicle Volumes
Sunset / Parkside Neighborhood (Weekdays vs Weekends)
Weekdays
Weekends
Lower Great Highway
between Quintara & Rivera
2,226
5,399
Lower Great Highway
between Judah/Irving
1,718
3,283
Lower Great Highway
between Ortega & Pacheco
2,376
4,976
Lower Great Highway
between Wawona & Vicente
2,149
4,410
Lincoln Way
between 42st & 43th Avenues
7,987
10,616
Lincoln Way
between 23th & 24th Avenues
17,891
16,516
45th Avenue
between Wawona & Sloat
2,845
3,840
Sloat Boulevard
between 41st & 42nd Avenues
13,725
12,009
Sloat Boulevard
between 36th & 35th Avenues
15,482
13,814
NB Sunset Blvd
between Ortega & Pacheco
9,616
8,954
SB Sunset Blvd
between Moraga & Noriega
8,827
9,854
Average Daily Volume
7,713
8,516
Emergency Response Times

To address concerns that a potential increase in vehicle traffic across the neighborhood may have a negative impact on emergency response times, we analyzed 16,445 calls to 911 originating from the neighborhood since the pilot program began in August 2021.

Our analysis found that the San Francisco Fire Department's average response time to an emergency in the neighborhood was 12.42% faster on the weekend than on weekdays. We also found that emergency response times across San Francisco are 15.00% faster on weekends as you can see in the table to the right.below.

Average Emergency Response Times
Sunset / Parkside Neighborhood vs San Francisco
Sunset / Parkside
San Francisco
Weekdays
9 : 03
8 : 03
Weekends
8 : 03
7 : 00
Explore Vehicle Crashes and 911 Calls Across the Neighborhood Since August 2021

A note about emergency response times: 911 calls are assigned one of four categories when they are received: Fire, Alarm, Potentially Life-Threatening and Non Life-Threatening. However, sometimes these assigments change as more information is received, which can influence the call's response time. Every 911 call has a "Final Call Priority" which identifies whether or not it was ultimately determined to be an emergency. This is noted by a red (emergency) or gray (non-emergency) capital letter "E" in the panel next to the map. While some 911 calls may have been initially classified as "potentially life-threatening", it's important to note the final emergency determination when evaluating each call's response time.

Case Studies
To inform our predictions of the economic impacts of converting the Great Highway into a park, we analyzed 8 projects that had undergone similar transformations and asked the following questions.
How has foot traffic to the neighborhood changed?

Every one of our case studies attracts millions of visitors each year. The High Line in New York City attracts 8 million visitors while Hudson River Park attracts 17 million annual visitors. Tom McCall Waterfront Park in Portland attracts 5 million annual visitors and the Indianapolis Cultural Trail, Rose Kennedy Greenway and Atlanta Beltline each attract between 1 - 2 million annual visitors.

How have local businesses benefited from the park's creation?

The High Line generates $61M in additional annual spending at nearby businesses. 48% of businesses near the Indianapolis Cultural Trail reported increased revenue after the trail opened and visitors to the trail spend $21M annually. Businesses near the Atlanta Beltline are projected to grow by 19% over the next 20 years.

How has the park impacted nearby property values?

The High Line immediately increased property values within ⅓ of a mile by 17.6%. The value of property taxes collected in the Hudson River Park neighborhood grew by 230% after the park's creation. In anticipation of the Atlanta Beltline’s construction, properties within ¼ mile to ½ mile of the park increased by 32% and in Indianapolis, property values near the Indianapolis Cultural Trail increased by a whopping 148% before the trail was constructed.

How many jobs has the park created?

The High Line created 20,000 jobs in its first year. Hudson River Park directly supported more than 3,000 full and part-time jobs and indirectly generates an additional 400 jobs annually within New York City. Over 15 years, the Atlanta Beltline is estimated to have created 62,860 construction jobs and 29,400 permanent jobs and the Indianapolis Cultural Trail is estimated to have created 11,372 jobs over the past 10 years.

How much additional tax revenue has the park generated?

The High Line generated $100M in property tax revenue in its first year and continues to generate $65M in tax revenue annually. The Atlanta Beltline generated $325M in property tax revenue in its first 12 years. The Rose Kennedy Greenway generates $10M annually for the City of Boston and Tom McCall Waterfront Park in Portland generates $56M in tax revenue annually.

How much ecomomic activity has the park generated for the surrounding region?

The Indianapolis Cultural Trail induced $864M in regional economic activity in its first 10 years. Hudson River Park produced $1.121 billion in indirect economic benefits for New York City between 2000 and 2015. The Atlanta Beltline induced $9 billion in regional economic development projects designed to support local businesses and help people find jobs.

New York City, NY
High Line
The High Line is a linear, elevated park located on the west side of Manhattan. The park is built on historic, elevated rail tracks and contains over 500 species of plants and trees.
Date Opened: 2009 (1st section)
Physical Footprint: 1.45 Miles Covering 7.43 Acres
Annual Visitors: 8 Million

Overview

The High Line was originally constructed in the 1930s as part of the West Side Improvement Project, designed to elevate dangerous freight trains off of Manhattan's streets. The West Side Elevated Line, as it was called, was used to transport goods, primarily meat, dairy, and produce, to and from the factories and warehouses in Manhattan’s Meatpacking District, West Chelsea, and Hell’s Kitchen.With the rise of trucking in the 1950s, train use began to decline and West Side Elevated Line was eventually shut down in 1980. After the railway ceased operations, the elevated structure was left abandoned and, over time, it became overgrown with wild vegetation. In the late 1990s, the City of New York and property developers advocated for the High Line's demolition, seeing the rusting structure as a hindrance to real estate development and an eyesore.

In 1999, a group of local residents, led by Joshua David and Robert Hammond, co-founded the nonprofit organization Friends of the High Line. They envisioned transforming the abandoned railway into a public park instead of demolishing it. Their efforts sparked public interest and gained support from politicians, urban planners, and philanthropists. In 2002, New York Mayor Michael Bloomberg embraced the idea of converting the High Line into a park, and the city began working on a plan to preserve and transform it. In 2004, advocates secured support from NYC officials and The West Chelsea Special District was created to facilitate the redevelopment of the High Line as a park. In 2009, after 4 years of construction, the first segment of the park between Gansevoort and 20th Street opened.

The High Line has become not only a recreational space but also a cultural hub, with public art installations, performances, and events. Its design incorporates a mix of native plants, maintaining an element of the wild landscape that once overgrew the abandoned tracks. The High Line is often cited as a model of urban renewal, merging nature, art, and history into a unique public space and its success has inspired similar projects around the world.

Economic Impacts

8,000
Temporary Construction Jobs Created in the First Year
12,000
Permanent Jobs Created in the First Year
17.6%
Increase in Property Values Within 1/3 Mile of the Park
$61M
Additional Annual Spending at Local Businesses
$100M
Additional Property Tax Revenue Generated in the First Year
$65M
Additional Tax Revenue Generated Annually

In its first year, the High Line generated 8,000 jobs related to its construction and 12,000 jobs in the redevelopment area surrounding the park. According to a 2019 report by HR&A Advisors, the High Line helps generate $50 million a year in local spending, which adjusted for inflation is $61M today.A 2014 research paper estimates that the High Line immediately increased property values within ⅓ of a mile by 17.6% resulting in over $100 million in additional property tax revenue for the City of New York in 2010. A 2020 study estimates that homes within 80 meters of the High Line experienced a 35.3% increase in value with the bulk of that captured by multi-story homes with a view of the park.

The Landscape Architecture Foundation (LAF) estimates that the High Line has catalyzed $2 billion in new construction resulting in over 3,000 new homes across West Chelsea with approximately ⅓ of those designated as affordable housing.

By the end of 2011, New York City had spent $115 million on building the High Line and thus the property tax revenue generated in 2010 alone was almost sufficient to cover the costs of constructing the park. As of 2018, the city's investment in the High Line is closer to $140 million, while the incremental tax revenue attributed to the park is almost $1.4 billion, more than 900% of the cost to construct it. The LAF estimates that the High Line continues to generate $65 million in tax revenue annually.

Additional Reading

Atlanta, GA
Atlanta Beltline
The Atlanta Beltline is a wide-ranging urban redevelopment program to connect 45 neighborhoods in the City of Atlanta to a network of public parks, multi-use trails, transit, and affordable housing along a 22-mile historic railroad corridor surrounding the central business district.
Date Opened: 2008 (1st Section)
Physical Footprint: 1,300 Acres
Annual Visitors: Over 2 Million

Overview

The Atlanta Beltline is one of the most significant urban redevelopment projects in Atlanta's history, designed to transform old railway corridors into a 22-mile loop of multi-use trails, public parks, transit systems, and residential and commercial developments. The concept was first introduced by Ryan Gravel in his 1999 master's thesis at Georgia Tech. Gravel envisioned repurposing underutilized rail lines circling Atlanta into a space that would connect neighborhoods, improve transportation, and promote economic development.Gravel's idea gained traction in the early 2000s with support from city officials, including Mayor Shirley Franklin. The Atlanta Beltline Partnership, a nonprofit organization, was established to raise funds and support the project, and Atlanta Beltline Inc. was created to oversee planning and development. The project was financed through a combination of public and private funding, including Tax Allocation District (TAD) bonds, which directed property tax increases to fund the project. The Beltline was also supported by federal transportation grants.

The first phase of the West End Trail opened in 2008 and the Eastside Trail, which opened in 2012, has became a popular spot for residents and tourists alike, spurring residential and commercial development along the corridor.

One of the most significant controversies surrounding the Beltline has been its role in accelerating gentrification and displacement. As the project revitalized previously underserved or industrial areas, property values and rents skyrocketed, especially in neighborhoods like Old Fourth Ward, Reynoldstown, and West End. This led to concerns about low-income residents being priced out of their homes and communities. Critics argued that the Beltline project failed to protect affordable housing and support the original residents of these neighborhoods.

The Westside Trail, completed in 2017, has begun to address the need for more investment in historically marginalized communities and new policies have been introduced to increase affordable housing throughout the Beltline. The project has garnered national attention as a blueprint for sustainable development and urban revitalization and has created nearly 100,000 jobs since construction began in December 2005.

Economic Impacts

62,860
Construction Jobs Created
29,400
Permanent Jobs Created
19%
Local Business Growth Over 20 Years
$150,000
Average Retail Sales by Pop-Up Businesses on Park Trails
22.25%
Increase in Property Values Within 1/2 Mile of the Park
$325M
Additional Property Tax Revenue Generated over 12 Years

In 2005, the City of Atlanta came together with Atlanta Public Schools and Fulton County and Atlanta City Council to create the Beltline Tax Allocation District (TAD) to finance the project using future property tax revenues from properties near the Beltline. In 2009, a year after the first segment of the Beltline opened, the TAD raised $7.4 million for investment into the project and between 2005 and 2017 it generated $325 million. To complete the Beltline before the expiration of TAD funds in 2030, the Atlanta City Council created the Beltline Special Service District in 2021 to levy an additional tax on commercial businesses and apartments near the Beltline which is expected to raise $100 million by 2030.From 2000 to 2006, in anticipation of the Beltline’s construction, properties within ¼ mile to ½ mile of the Beltline increased in value by 32% more than homes that are 2 miles away. From 2011 to 2015, home values within ½ mile of the Beltline increased between 17.9% and 26.6% compared to the rest of Atlanta.

In 2022, businesses within ½ mile of the Beltline generated $3.5 billion in retail sales with over $1.5 billion coming from tourism. Over the next 20 years, the number of businesses in the area is projected to grow by 19%. In 2023, the Beltline Marketplace program was created to allow small businesses to locate temporary pop ups along the trails. In the first 9 months of operations, these pop ups each generated about $150,000 in sales. Through 2020, Atlanta Beltline, Inc. directly invested over $1.7M in economic development funding acquired through public grants and philanthropic donations to support nearby businesses.

As of 2023, the Atlanta Beltline is estimated to have created 62,860 construction jobs and 29,400 permanent jobs (e.g. retail, hospitality and food services) as well as over $9 billion in economic development projects to support local businesses and help people find jobs.

Additional Reading

Boston, MA
Rose Kennedy Greenway
The Rose Fitzgerald Kennedy Greenway is a 17 acre linear park located in Downtown Boston. It stretches over one mile through Chinatown, the Financial District, the Waterfront, and North End neighborhoods.
Date Opened: October 2008
Physical Footprint: 1.5 Miles Covering 17 Acres
Annual Visitors: 1.4 Million

Overview

The Rose Kennedy Greenway is a 1.5-mile linear park that emerged from one of the most ambitious infrastructure projects in U.S. history, the "Big Dig." This urban park, completed in 2008, moved the elevated Interstate 93 underground, transforming a formerly congested area into a green public space. The elevated interstate had long been an eyesore, dividing neighborhoods like the North End from downtown Boston and the waterfront.The idea for the Greenway originated as part of the final design plans for the Big Dig, with the space above the new tunnels designated for public use. It was named after Rose Fitzgerald Kennedy, matriarch of the Kennedy family, in honor of her long-standing Boston roots.

The Greenway includes several key areas such as the North End Parks, Wharf District Parks, Dewey Square, and the Chinatown Park. Each area incorporates green space, seating, public art, and places for community events, designed to reconnect neighborhoods that had been previously divided by the highway.

A major controversy surrounding the Greenway was the cost of maintaining the park and who should bear the financial burden. Initially, there was debate over whether the city, state, or private entities should fund its upkeep. In the end, the Rose Kennedy Greenway Conservancy took over management of the park and the Greenway Business Improvement District was formed to fund its maintenance via an elective tax on nearby properties.

The Greenway has become a valuable urban green space and hosted over 400 free events in 2023 including food festivals, farmers' markets and art installations. It provides a scenic, recreational corridor that has reconnected several of Boston’s historic neighborhoods and has revitalized downtown Boston.

Economic Impacts

100s
of Jobs Created
$10M
Annual Revenue Generated
30%
Increase in Nearby Property Values

The Greenway was the final phase of the Big Dig project, which at it’s peak employed more than 5,000 landscape architects, planners, construction workers, and park designers. Estimates suggest that several hundred jobs were directly related to the Greenway’s construction and landscaping efforts between 2004 and 2008.The Rose Kennedy Greenway Conservancy, the non-profit that manages the Greenway, generated $8.4 million in revenue in 2023 via grants, fundraising events and various fees related to ticketed attractions throughout the Greenway. These funds cover the cost of producing and staffing the Greenway’s many events.

The Greenway Business Improvement District (BID) generates approximately $1.6 million each year to support the maintenance, horticulture costs, and ongoing enhancements of The Greenway. Properties that meet certain criteria within the BID boundaries pay a special assessment as part of their property taxes to support improvements that benefit property owners and the public alike.

A 2022 analysis by HR&A Advisors estimates that the average property value of commercial buildings adjacent to the Greenway rose 30% over those in Boston’s Central Business District after the Greenway was completed.

Additional Reading

New York City, NY
Hudson River Park
Hudson River Park stretches along the west side of Manhattan, from Battery Park to 59th Street. It is the second-largest park in Manhattan after Central Park and one of the longest waterfront parks in the U.S.
Date Opened: 2003
Physical Footprint: 4.5 Miles Covering 550 Acres
Annual Visitors: 17 Million

Overview

Hudson River Park was officially established in 1998, but its origins date back to several urban planning and waterfront development initiatives in the 20th century. For much of the 19th and 20th centuries, the Hudson River waterfront was dominated by shipping and industrial activities, with piers, warehouses, and railroad terminals along the river. In 1929, the West Side Elevated Highway was built over much of what is the park today. However it was poorly maintained and torn down in 1973 when chunks of its facade began to fall and a truck and car fell through it at 14th Street.In the 1970s, urban planners and politicians began to look at revitalizing the waterfront. One of the first major proposals was the Westway project in 1974, a controversial plan to replace the West Side Elevated Highway with a new highway that would be buried in landfill alongside the Hudson River. The Westway plan faced strong opposition, particularly from environmentalists, who were concerned about the impact on the Hudson River's marine life, especially striped bass habitats. After years of legal battles, the project was officially scrapped in 1985.

The failure of the Westway project led to renewed efforts to develop the waterfront in a different way. In 1998, New York State and City officials came together to pass The Hudson River Park Act which established the park as a joint state-city project to be managed by the Hudson River Park Trust, a public benefit corporation.

Today Hudson River Park is widely considered a massive success in transforming a neglected industrial waterfront into a dynamic public space. It continues to evolve, with ongoing efforts to address concerns related to its environmental sustainability. The park covers about 550 acres of land and water, and it has become one of Manhattan’s most popular recreational spaces.

Economic Impacts

3,000+
New Jobs Directly Related to the Park
53,000
New Jobs Indirectly Related to the Park
20%
Increase in Nearby Property Values Within First Two Years
230%
Increase in Property Tax Revenue from 2000 - 2015
112%
Increase in Seniors Living Near the Park
66%
Increase in Children Living Near the Park

As of 2015, Hudson River Park directly supported more than 3,000 full and part-time jobs and indirectly generates an additional 400 jobs annually within New York City. The number of jobs directly supported by the park is expected to grow to approximately 5,000 over the next few years with improvements to Piers 26, 54, and 57. Total employment in all sectors for the Hudson River Park neighborhood has grown by 53,000 new jobs from 2002 to 2013 (+34%), for a total of more than 210,000 jobs as of 2013.From 2000 to 2015 the total value of all property taxes collected in the Hudson River Park neighborhood grew by 230%, outpacing the rest of Manhattan by 50%. This reflects the high premium that Hudson River Park produces for nearby properties. In the first two years after the completion of the Greenwich Village segment of the park (2003-2005), the park was responsible for 20% of the increase in the sale prices of properties within two blocks of the park.

The number of families and seniors near the park is also growing. From 2000 to 2014, the Hudson River Park neighborhood has grown in every population category. With strong gains in youth (+66%) and seniors (+112%). The neighborhood’s total population has grown quickly, from 46,400 in 2000 to 71,700 residents as of 2014 (+54%).

Estimates from the U.S. Department of Commerce’s Regional Input-Output Modeling System (RIMS II) found that between 2000 and 2015, Hudson River Park produced $1.121 billion in indirect economic benefits for New York City. This represents a 156% return on public and private investments in the park. These figures ratify Hudson River Park as a major economic engine for New York City and beyond.

Additional Reading

Indianapolis, IN
Cultural Trail
The Indianapolis Cultural Trail is an urban bike and pedestrian path that connects neighborhoods, cultural districts, and major landmarks across the city.
Date Opened: May 2013
Physical Footprint: 8 Miles Covering 11.25 Acres
Annual Visitors: Over 1 Million

Overview

The Indianapolis Cultural Trail is an urban bike and pedestrian path that weaves through downtown Indianapolis, connecting neighborhoods, cultural districts, and major landmarks. The idea for the trail emerged in the early 2000s and was spearheaded by Brian Payne, president of the Central Indiana Community Foundation. The goal was to create a world-class urban greenway that would enhance the city's connectivity and promote tourism, community well-being, and local economic development.Before the Cultural Trail was developed, the land was primarily used for traditional city infrastructure: roadways, parking lanes, and sidewalks. The trail follows existing streets but repurposed space that had been allocated for vehicular traffic or parking. Many of these streets ran through underutilized or blighted areas in the downtown core, and converting them into a multi-use path aimed to revitalize these zones and spur economic growth. The areas along the trail included stretches that were not heavily trafficked, including portions where industrial or commercial activities had diminished.

The creation of the trail required narrowing certain roads, reducing the number of parking spaces, and rerouting traffic patterns. These changes were met with resistance from some business owners and local residents who were concerned about the loss of convenient parking and potential disruptions to traffic.

The trail's development was funded by a combination of private philanthropy and public funds, with Lilly Endowment Inc. being a major donor. The total cost was approximately $63 million. Critics questioned whether this money would be better spent on other infrastructure needs or public services, while supporters viewed it as an investment in urban revitalization and a long-term economic catalyst.

The Cultural Trail is considered a pioneering model for urban infrastructure projects, blending public art, green space, and transportation, while also promoting sustainability. It now serves as a national example of how cities can reimagine the use of public space to foster economic, cultural, and environmental benefits.

Economic Impacts

48%
Of Local Businesses Reported Increased Revenue Within 12 Months
$53
Average Amount Spent by Trail Visitors at Local Businesses in 2014
$21M
Estimated Annual Spending by Trail Visitors at Local Businesses
11,372
Jobs Created Over 10 Years
148%
Increase in Property Values
$864M
Estimated Induced Regional Economic Activity Over 10 Years

In a survey conducted in 2014, a year after the trail opened, 48% of nearby business owners reported increased revenue and over half said they saw an increase in customers. Visitors surveyed reported spending an average of $53 at businesses near the trail and 47% said they had spent or planned to spend money during their visit. A 2015 report by the Indiana University Public Policy Institute estimates that 8 segments of the trail each generate anywhere between $963K – $3.2M, or roughly $2M, in local spending annually. This equates to $16M across the entire trail which is $21M today adjusted for inflation. Indianapolis Cultural Trail, Inc. estimates that the trail has produced $864.5 million in regional economic activity, including real estate redevelopment near the trail, since the trail opened.The 2014 survey also found that the trail led to the creation of 40 – 50 full time jobs and 47 part time positions in its first year. 36.8% of businesses surveyed reported hiring additional part-time staff to accommodate the increase in foot traffic induced by the trail. Indianapolis Cultural Trail, Inc. estimates that the project is directly responsible for creating 11,372 jobs over the past 10 years.

From 2008 to 2014, the gross assessed value of properties within 500 feet of the Indianapolis Cultural Trail increased by 148%, resulting in over $1 billion in additional property value at an average of $580,180 per property. Since 2008, over $300 million in new development has been constructed along the Indianapolis Cultural Trail.

Additional Reading

New York City, NY
Gotham Park
Gotham Park is a project in development to revitalize the area under the Brooklyn Bridge in Manhattan on the edge of the Chinatown, South Street Seaport, Two Bridges, and Financial District.
Date Opened: May 24, 2023
Physical Footprint: 9 Acres
Annual Visitors: 7.5 Million

Overview

In 1972, the City of New York created a pedestrian plaza under newly constructed exit ramps on the Manhattan side of the Brooklyn Bridge, but since then the space has been neglected by the state. In the 1980s, local skateboarders began to meet on the site and by the early 2000s it was known as “Brooklyn Banks”, the informal centerpoint of the city’s skateboarding culture. Skateboarders were kicked out of the site in 2004 and then again in 2010 so that the City could perform landscaping and infrastructure rehabilitation on the bridge, which is still ongoing.In 2020, civic activists and advocates from the skating and environmental communities came together to demand that the space under the bridge be opened for public access. In 2021, Brooklyn Bridge Manhattan Inc. was formed as a nonprofit to advocate for the conversion of the land under the bridge into a multi-use urban public space called Gotham Park.

Economic Projections
*

1,300
Jobs Related to the Park’s Construction Over 10 Years
2,440
Jobs Related to the Park’s Operations and Programming
$60M
Annual Spending Within the Park
$150M
Annual Spending at Local Businesses
5% - 10%
Increase in Property Values Within ½ Mile of the Park
$420M
Increase in Property Values Within ½ Mile of the Park
*
Economic projections were produced using methodologies discussed in this report.

The construction of Gotham Park began in 2023 and is scheduled to take place in three phases. The first phase, which is nearing completion, includes restoring the Small Banks Skate Park and adding basketball courts, bathrooms and wayfinding signs. The second phase requires $100M to restore the Big Banks Skate Park and build a library and event space and the third phase would use $50 million to create two green spaces on the eastern edge near the water. The construction of the park is estimated to produce $8M in state and local tax revenue in its first year along with an average of $92M annually after its completion. After 30 years, the project is expected to generate $1.5B in total tax revenue.Gotham Park is projected to create 1,300 construction jobs over the next ten years. Ongoing park operations and programming is projected to create 2,440 full time jobs and induce an additional 865 throughout the neighborhood.

Once phase 2 of the project is complete, the 461 real estate properties within ½ mile of the park are expected to increase in value by 5%, cumulatively generating an additional $390M in property value. The 32 properties within 750 feet of the park are expected to increase in value by 10%, cumulatively generating an additional $30M in property value, or approximately $930,000 each. These 493 properties together are projected to increase by $420M in market value which will result in an additional $46M in new annual tax revenue for the New York City.

Additional Reading

Portland, OR
Tom McCall Waterfront Park
Tom McCall Waterfront Park is a 36.59 acre park located in Downtown Portland, Oregon, along the Willamette River.
Date Opened: 1978
Physical Footprint: 36.59 Acres
Annual Visitors: 5 Million

Overview

The creation of Tom McCall Waterfront Park in Portland, Oregon, was a transformative urban development project with both historical significance and controversy.The park is named after Governor Tom McCall, who was known for his environmental vision and advocacy. The area where the park now stands was originally occupied by Harbor Drive, a busy riverfront highway built in the 1940s. In the 1960s and early 1970s, Portland was grappling with urban sprawl and congestion and the city’s leadership sought ways to improve livability, enhance public spaces, and embrace environmentalism.

In 1968 the Oregon State Highway Department proposed expanding Harbor Drive which Governor Tom McCall rejected and called for a study to explore replacing the highway with a waterfront park.

In 1974, a groundbreaking decision was made to remove Harbor Drive—one of the first freeway removals in U.S. history. This allowed the creation of Tom McCall Waterfront Park, which opened officially in 1978. The park was designed to reconnect the city to the Willamette River, providing open spaces for recreation, festivals, and a scenic promenade. It was a milestone in urban planning that set a precedent for waterfront development and prioritizing green spaces over vehicular infrastructure.

The decision to remove Harbor Drive was very controversial at the time. Many Portlanders were concerned about the loss of a major roadway that was seen as critical to downtown traffic flow and regional transportation. Critics feared that removing the highway would increase congestion on nearby streets and negatively impact commerce by making downtown less accessible.

However, supporters of the plan, including Governor McCall and urban planners, argued that the benefits of reclaiming the waterfront for public use outweighed the transportation concerns. They believed that Portland needed more green spaces to balance its rapid urban growth and that such spaces would boost livability, tourism, and long-term economic growth. The city's commitment to public participation also played a key role, as citizen advocacy groups pushed for greater emphasis on livability, civic engagement, and environmental stewardship.

In the end, the removal of Harbor Drive proved to be a massive success. Traffic issues were mitigated by upgrading nearby streets and highways, and the park became a popular destination. Tom McCall Waterfront Park is now one of the city's most iconic public spaces, hosting events such as the Portland Rose Festival and the Oregon Brewers Festival while providing a scenic venue for recreational activities along the Willamette River.

The creation of Tom McCall Waterfront Park is often celebrated as a forward-thinking urban planning achievement that helped Portland develop its reputation as a livable, environmentally conscious city​.

Economic Impacts

1000s
of Jobs Created
$56M
Additional Annual Revenue

Tom McCall Waterfront Park hosts several events throughout the year that generate millions of dollars in revenue for local businesses. The annual Oregon Brewers Festival attracts over 50,000 visitors each year and in 2014 contributed $32.6 million to the local economy with $20.9 million coming from direct spending by visitors and vendors. The Waterfront Blues Festival, with admission fees ranging from $40 to $1,000, has raised over $10 million for local community causes like the Oregon Food Bank since its inception. The Portland Saturday Market, which operates from March to December, draws over 1 million visitors annually and generates an estimated $12 million in annual revenue. The annual Cinco de Mayo Festival and Bite of Oregon also drive considerable economic impact through vendor booths, food trucks, and merchandise sales. Oregon does not have a statewide sales tax so the impact of these events on sales tax revenue is limited compared to states with such a system.The creation of Tom McCall Waterfront Park spanned approximately four years from the time of Harbor Drive's removal in 1974 to the park's official opening in 1978. The project generated thousands of jobs during its development and has had a long-term impact on the local economy by indirectly supporting hundreds of jobs through tourism, events, and the growth of nearby businesses.

Additional Reading

South Korea
Cheonggyecheon Stream
Cheonggyecheon Stream is a public park in downtown Seoul that was once covered by an elevated freeway.
Date Opened: 2005
Physical Footprint: 10.9 KM Covering 226.25 Acres
Annual Visitors: 23.4 Million in 2016

Overview

The Cheonggyecheon Stream Restoration Project is one of the most ambitious urban renewal projects in South Korea. It transformed a neglected, buried waterway in the heart of Seoul into a vibrant public space.Originally covered by an elevated highway, the stream was restored in the early 2000s, creating a linear park that runs for nearly 11 kilometers (6.79 mi) through the city center. The Cheonggyecheon restoration project initially attracted significant public criticism, but since its opening in 2005 it has become popular among residents and tourists and is lauded as a major success in urban renewal and beautification.

Approximately 168,000 vehicles drove on the the elevated highway daily before its destruction, with an estimated 62.5% of them routinely struck in traffic. The project sped up traffic around the city when the motorway was removed. It has been cited as a real-life example of Braess's paradox.

Economic Impacts

$1.9M
Annual Tourism Spending
3.5%
Increase in Nearby Businesses
30-50%
Increase in Nearby Property Values
35%
Reduction in Air Pollution
5°C
Temperature Reduction
15%
Increase in Public Transit Ridership

When the restoration began in 2002, the number of businesses in the Cheonggyecheon area increased by 3.5% which was double the rate of business growth in downtown Seoul. The number of working people in the Cheonggyecheon area also increased by 0.8%, versus a decrease in downtown Seoul of 2.6%. The project attracts an average of 64,000 visitors daily, of which approximately 1,408 are foreign tourists who contribute up to 2.1 billion won ($1.9 million USD) to the Seoul economy annually.The price of land within 50 meters of the restoration project increased by 30-50% which is double the rate of property increases in other areas of Seoul.

The project is also credited for reducing air polution by 35% and a 15.1% increase in bus ridership in Seoul between 2003 and the end of 2008.

Additional Reading

About This Project
About
This Project

This project was independently produced by our non-partisan team of researchers and was not funded by any political organization in support of or against Proposition K.