%20--%3e%3csvg%20version='1.1'%20id='Layer_1'%20xmlns='http://www.w3.org/2000/svg'%20xmlns:xlink='http://www.w3.org/1999/xlink'%20x='0px'%20y='0px'%20viewBox='0%200%20400%20400'%20style='enable-background:new%200%200%20400%20400;'%20xml:space='preserve'%3e%3cstyle%20type='text/css'%3e%20.st0{fill:%23FFFFFF;}%20%3c/style%3e%3cg%3e%3cpath%20class='st0'%20d='M203.3,185.4h168.9c7.8,0,14.2,6.3,14.2,14.2c0,7.8-6.3,14.2-14.2,14.2H203.3c-7.8,0-14.2-6.3-14.2-14.2%20S195.5,185.4,203.3,185.4z'/%3e%3cpath%20class='st0'%20d='M27.3,332.1h344.9c7.8,0,14.2,6.3,14.2,14.2c0,7.9-6.3,14.2-14.2,14.2H27.3c-7.8,0-14.2-6.3-14.2-14.2%20C13.1,338.4,19.4,332.1,27.3,332.1z'/%3e%3cpath%20class='st0'%20d='M27.3,38.7h344.9c7.8,0,14.2,6.3,14.2,14.2s-6.3,14.2-14.2,14.2H27.3c-7.8,0-14.2-6.3-14.2-14.2%20S19.4,38.7,27.3,38.7z'/%3e%3c/g%3e%3c/svg%3e)
Neighborhood Pulse
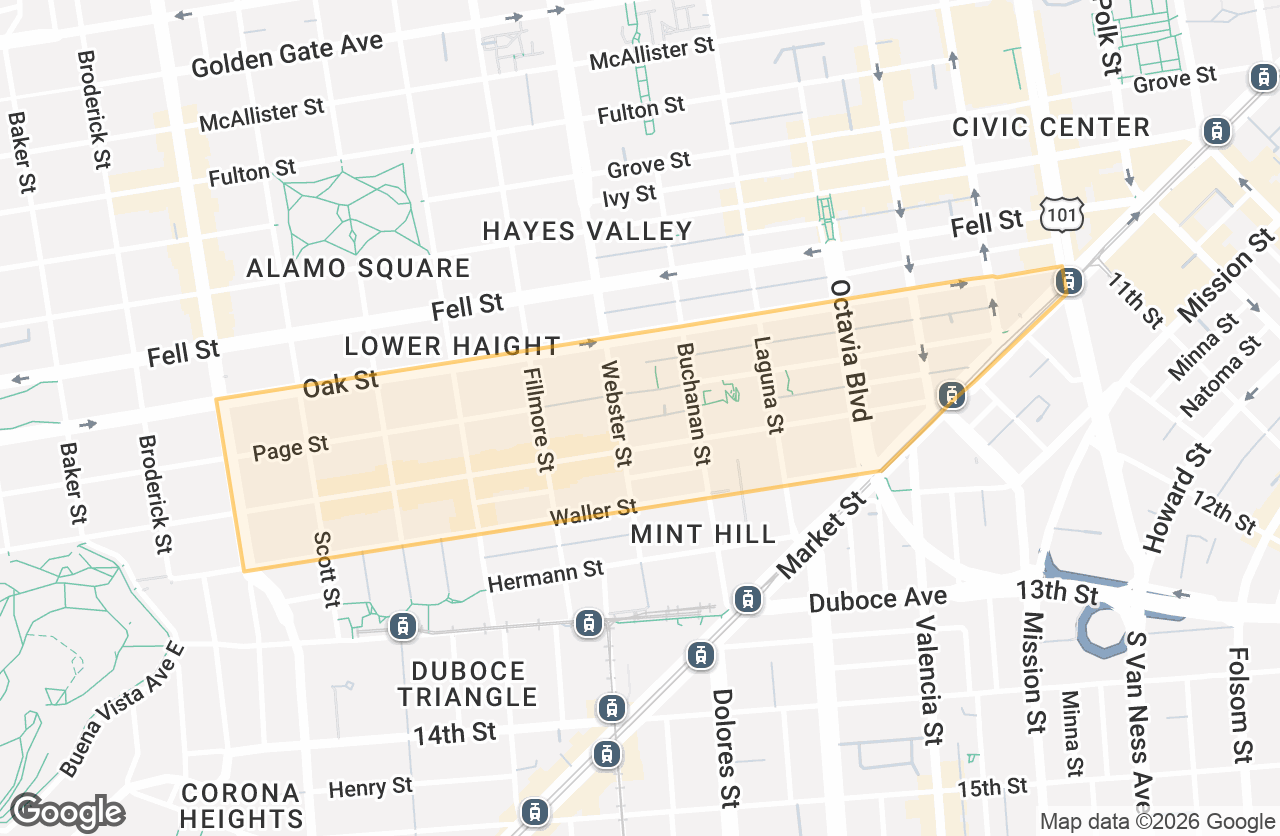
Lower Haight
A snapshot of the people who live in the neighborhood and the public safety challenges they face.
Demographics
Learn more
Race, Age, & Housing
Population characteristics, housing stability, and age distribution over time.
Population
7,238
Vulnerable Residents
1,829
Median Age
34
Median Income
$166,191
Traffic Safety
Learn more
Vehicle Related Injuries
Collision frequency & severity and our most dangerous streets.
Injuries Past 12 Months
49
% of Streets on High Injury Network
24.34%
Most Dangerous Street
Haight St
Octavia St – Laguna StMost Dangerous Intersection
Octavia St & Haight St
Police Reports
Learn more
Public Safety Incidents
Recent incident volume, geographic concentration, and trend movement.
Incidents Past 30 Days
52
Incidents Past 12 Months
741
% Change Past 6 Months
-10%
Most Prevalent Public Safety Issue
Larceny / Theft
911 Emergencies
Learn more
Fire & Medical Emergencies
Emergency call volume, response times, and call-type distribution.
Emergencies Past 30 Days
146
Emergencies Past 12 Months
1,575
Average Response Time
6 Mins & 52 Seconds
Most Common Emergency
Medical Incident
Community Concerns
Learn more
SF311 Complaints
Dirty sidewalks, illegal parking, and other neighborhood requests.
Requests Past 30 Days
1,127
Requests Past 12 Months
11,329
Average Response Time
18 hours : 14 mins & 49 seconds
Most Common Request
Street & Sidewalk Cleaning