%20--%3e%3csvg%20version='1.1'%20id='Layer_1'%20xmlns='http://www.w3.org/2000/svg'%20xmlns:xlink='http://www.w3.org/1999/xlink'%20x='0px'%20y='0px'%20viewBox='0%200%20400%20400'%20style='enable-background:new%200%200%20400%20400;'%20xml:space='preserve'%3e%3cstyle%20type='text/css'%3e%20.st0{fill:%23FFFFFF;}%20%3c/style%3e%3cg%3e%3cpath%20class='st0'%20d='M203.3,185.4h168.9c7.8,0,14.2,6.3,14.2,14.2c0,7.8-6.3,14.2-14.2,14.2H203.3c-7.8,0-14.2-6.3-14.2-14.2%20S195.5,185.4,203.3,185.4z'/%3e%3cpath%20class='st0'%20d='M27.3,332.1h344.9c7.8,0,14.2,6.3,14.2,14.2c0,7.9-6.3,14.2-14.2,14.2H27.3c-7.8,0-14.2-6.3-14.2-14.2%20C13.1,338.4,19.4,332.1,27.3,332.1z'/%3e%3cpath%20class='st0'%20d='M27.3,38.7h344.9c7.8,0,14.2,6.3,14.2,14.2s-6.3,14.2-14.2,14.2H27.3c-7.8,0-14.2-6.3-14.2-14.2%20S19.4,38.7,27.3,38.7z'/%3e%3c/g%3e%3c/svg%3e)
Maps & Analyses
Explore our collection of projects to help you fight for safer, healthier and more equitable streets.
Birthday Trees
San Francisco, CA

This is a fun project we created for Earth Day 2025. Enter your birthday to find which of San Francisco's estimated 125,000 street trees were planted on the day you were born.
Traffic Fatalities
San Francisco, CA
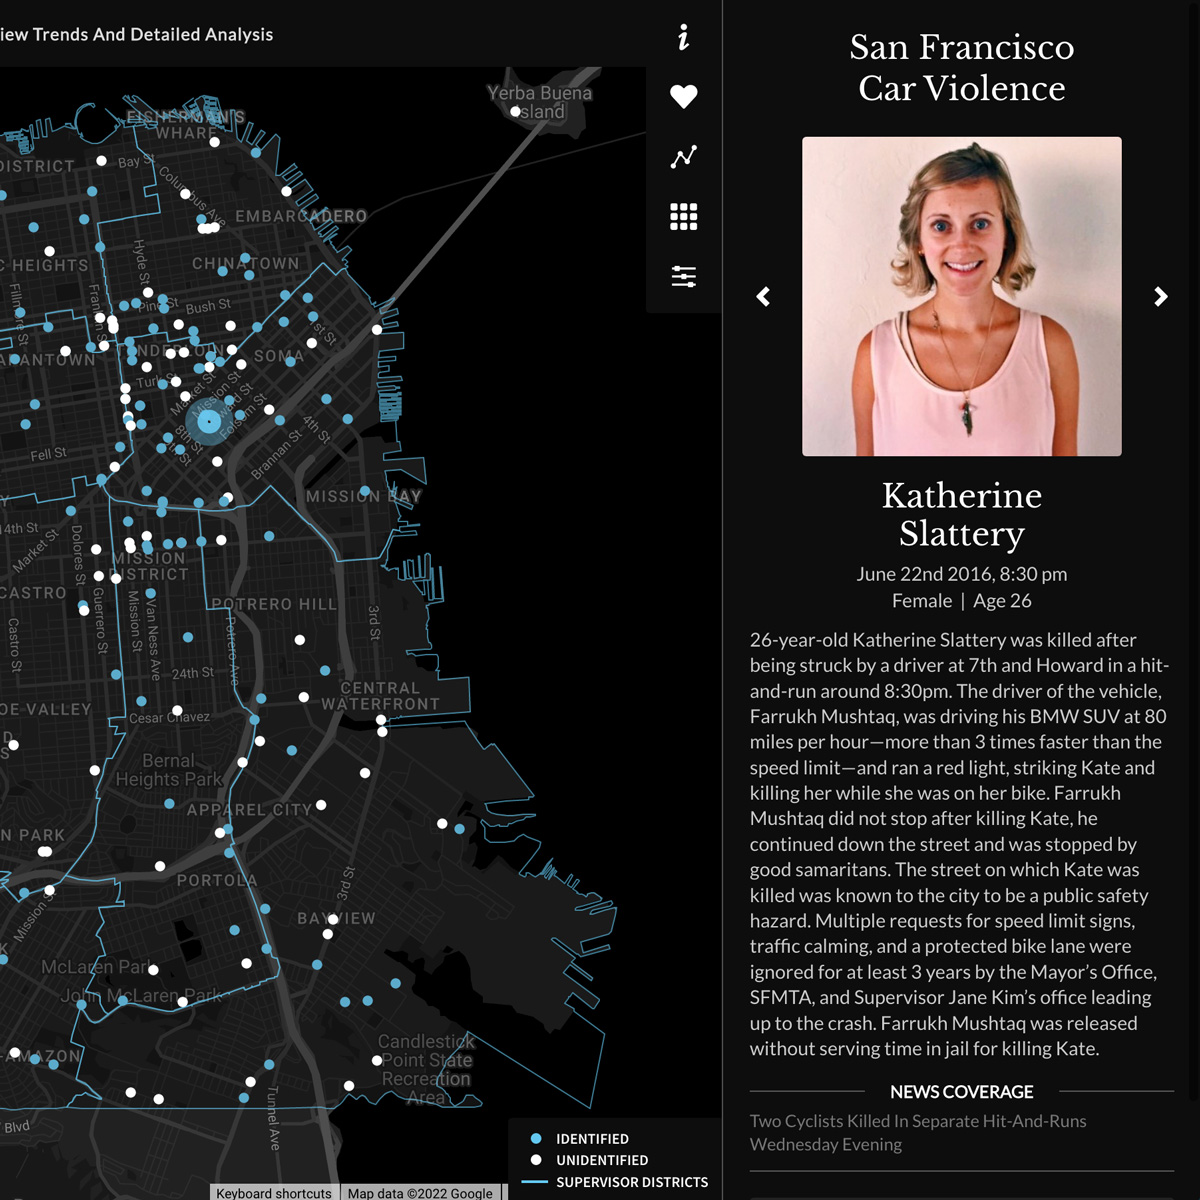
This project is a live data dashboard and map that shows where 621 people have been killed by motor vehicles in San Francisco since the city began record keeping in 2005. We have researched and crowdsourced information about each victim and the circumstances of their crash. This project is the most up-to-date, publicly available resource on traffic violence in San Francisco.
Slow Streets Public Safety Analysis
San Francisco, CA
On December 6th, 2022 the SFMTA Board of Directors voted to create a network of residential "Slow Streets" in San Francisco designed to limit through traffic to 1,000 vehicles per day at 15 MPH. This project is a live dashboard that shows the impact each of these Slow Streets have had on reducing vehicle crashes and emergency response times.
Congestion Relief Zone Vehicle Crash Tracker
Manhattan, NY
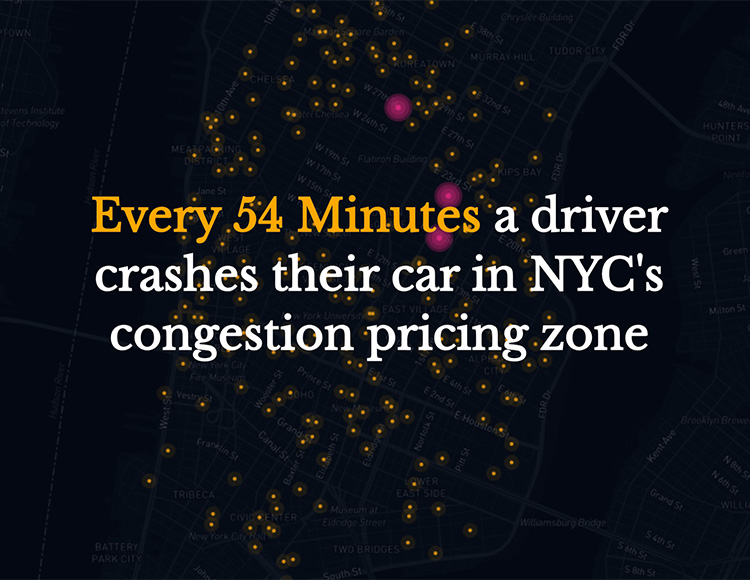
A live analysis of vehicle crashes in New York City's congestion relief zone, before and after congestion pricing began on January 5th, 2025.
Telraam Traffic Monitoring
Multiple Cities
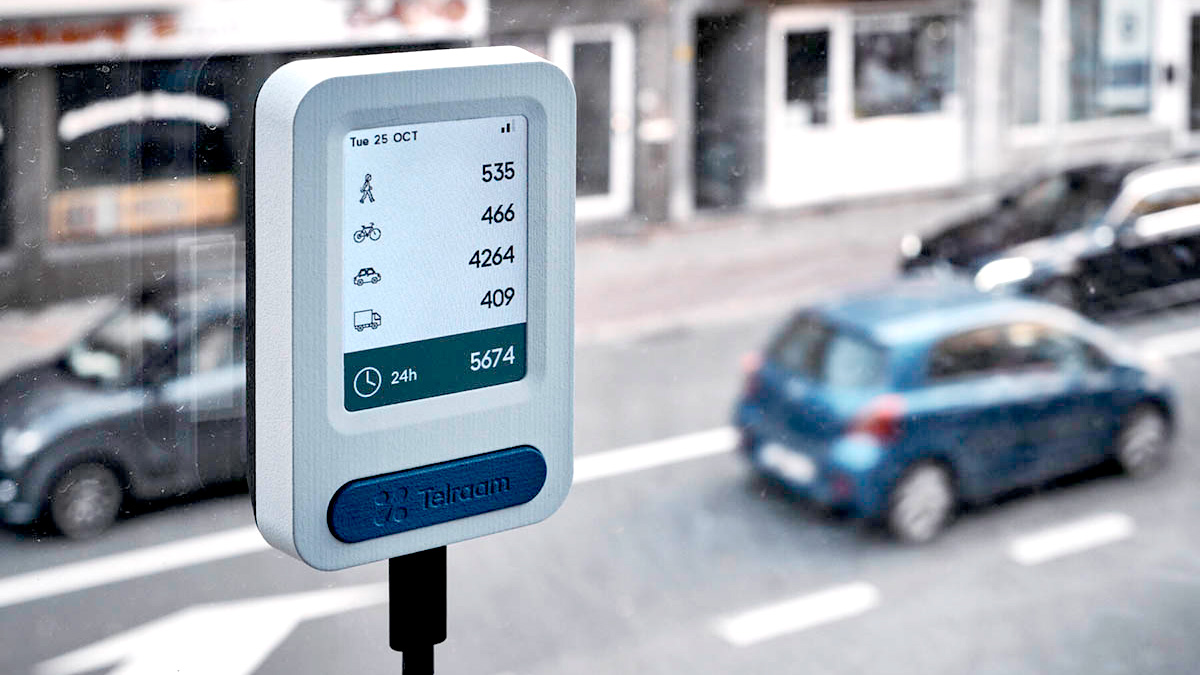
A live dashboard of Telraam traffic monitoring sensors in San Francisco and Berkeley, CA as well as an analysis of their effectiveness at getting policy makers to take action on the data they collect.
Ocean Beach Park Impact Analysis
San Francisco, CA
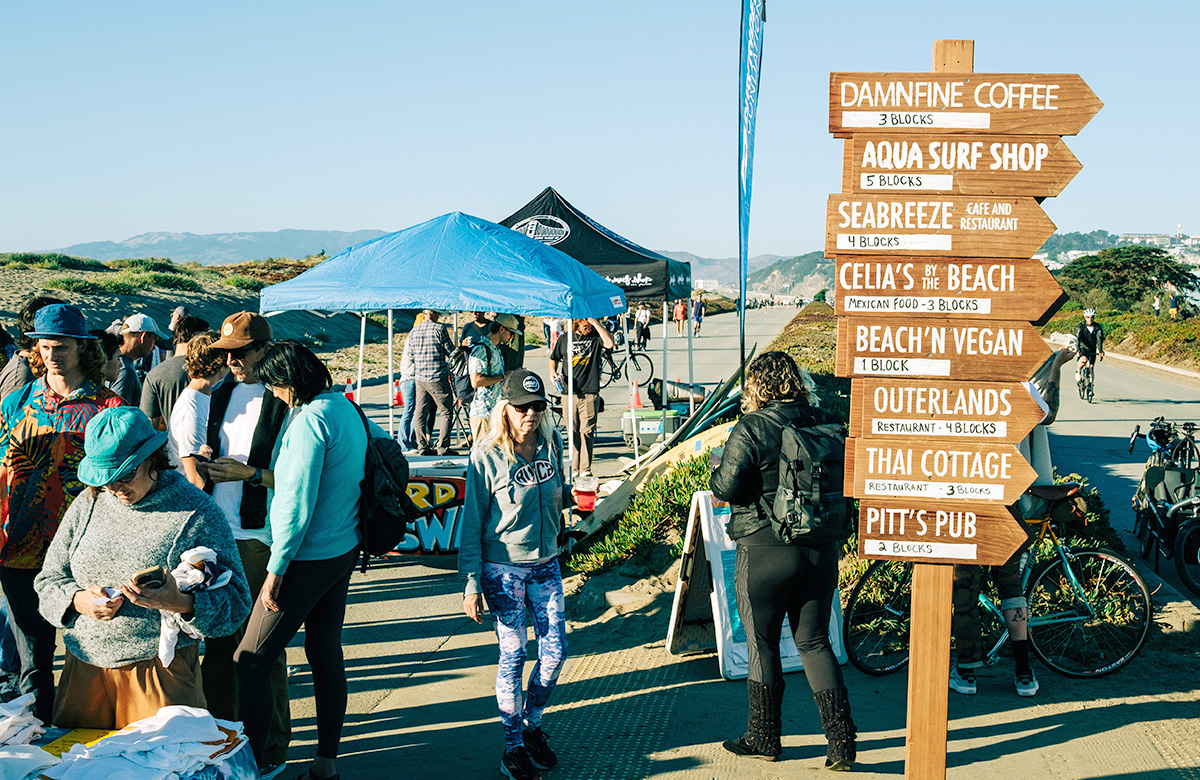
An analysis of the anticipated economic and public safety impacts of converting the Great Highway in San Francisco into an oceanfront park, informed by city data and eight case studies that had undergone similar transformations.
Portland Gas Tax Analysis
Portland, OR
On May 21st, 2024 Portlanders voted to renew a 10 cents per gallon gas tax to fund the Portland Bureau of Transportation’s “Fixing Our Streets” program. We analyzed 24 projects funded by the gas tax from 2020 – 2024 to understand their impact on traffic safety and racial and economic equity.
Car Ownership and Neighborhood Demographics
Multiple Cities
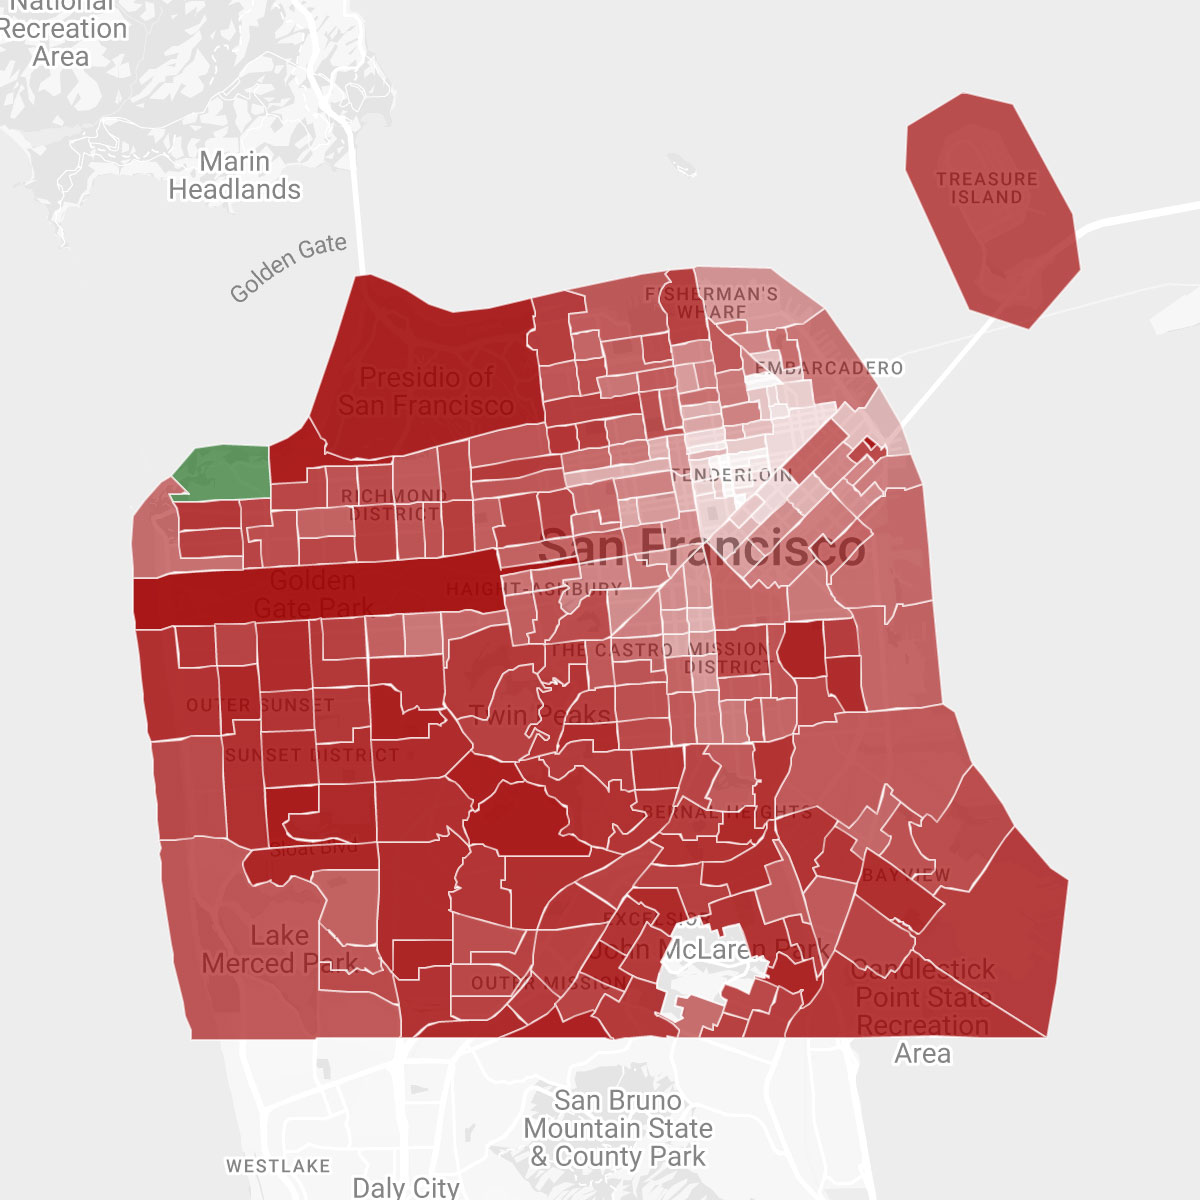
These maps show where cars live in a city alongside socioeconomic and demographic data that shows how residents primarily commute, their median income, race, age and whether they own or rent their home. These maps were created to help you advocate for restricting vehicle access in specific areas of your city where residents do not own cars and primarily walk, bike or take public transit to work.
Hayes Valley Shared Spaces
San Francisco, CA
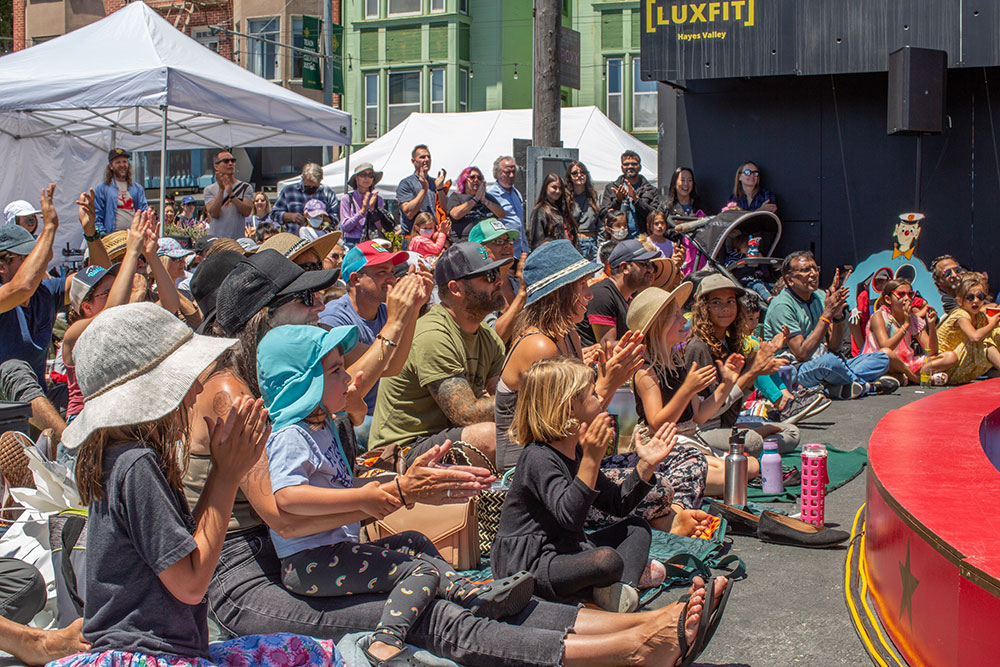
The Hayes Valley Shared Spaces (HVSS) program has been an economic lifeline for businesses along Hayes Street over the past 3 years and now it is at risk of being reduced from 3 days to 1. This analysis looks at 6 years of vehicle crash data, 911 calls and SFFD emergency response times to Hayes Street to understand the impact the HVSS program has had on public safety.
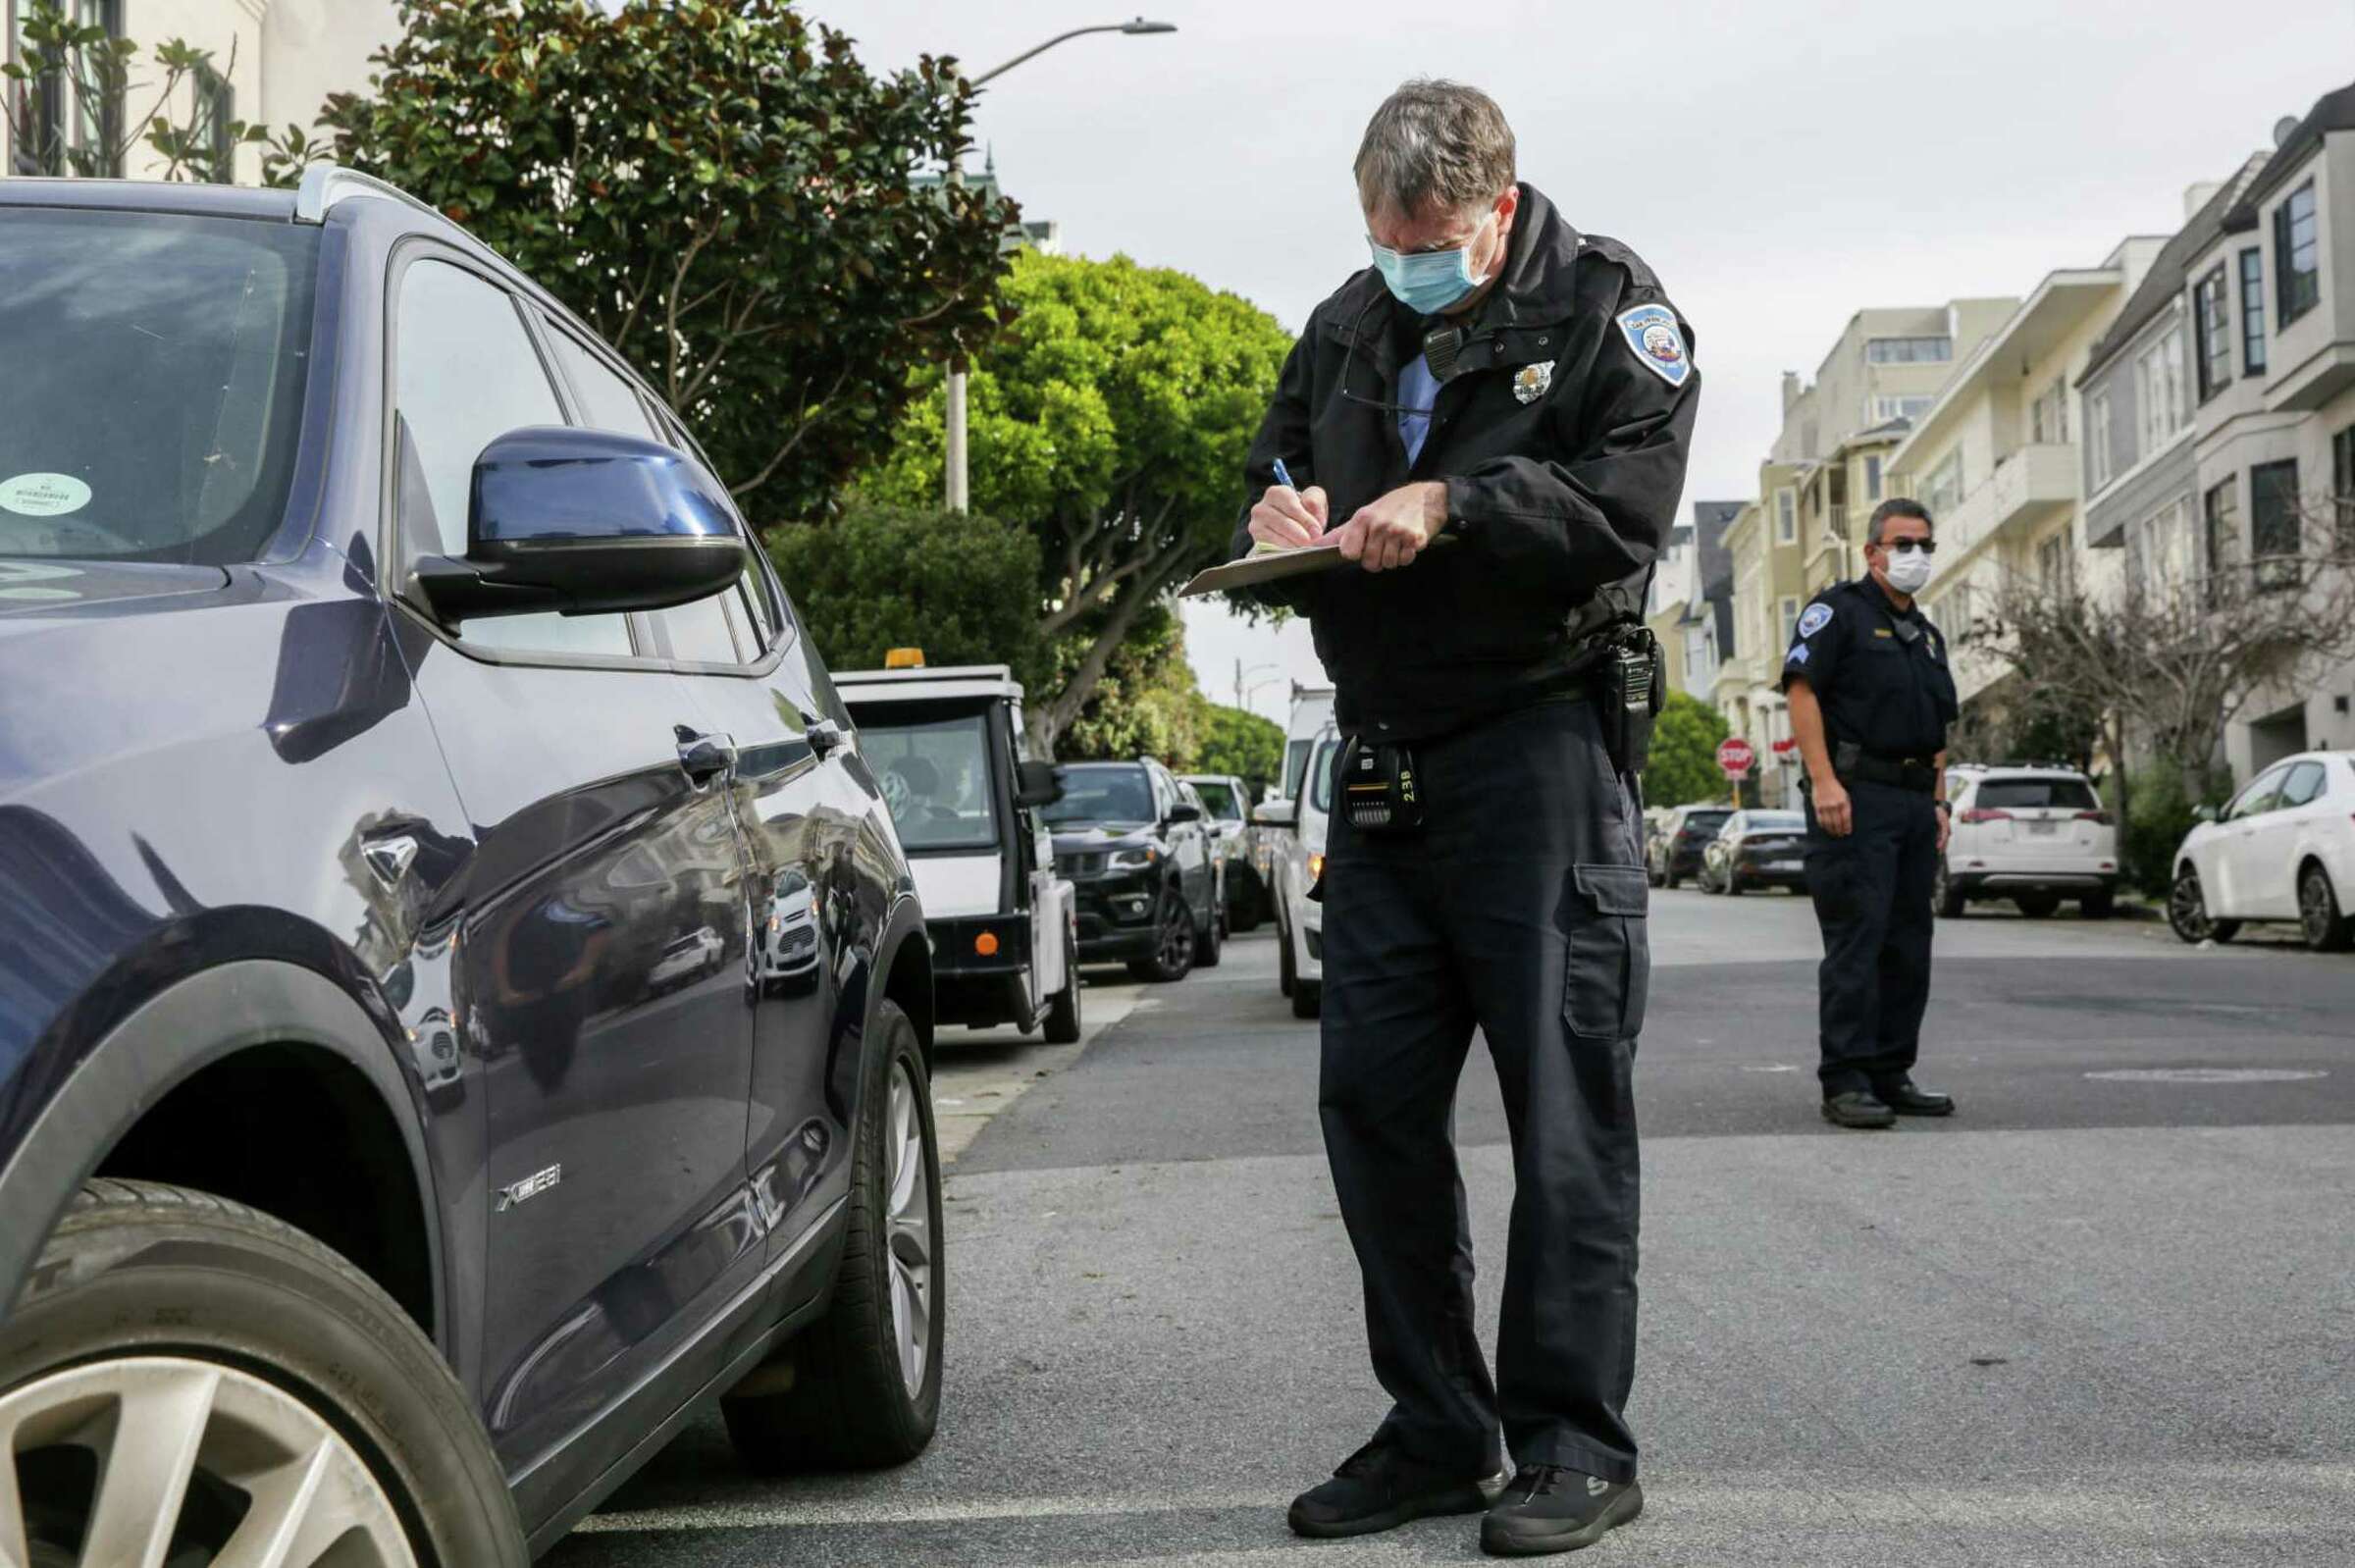
Parking Enforcement
San Francisco, CA
This analysis provides a detailed audit of 19.5 million SFMTA illegal parking citations since 2008 and shows not only where illegal parking violations are taking place but examines exactly which violations the SFMTA is prioritizing. We also analyzed the effectiveness of SFMTA's current parking enforcement strategy through a both economic and public safety lens and highlight repeat offenders by license plate.
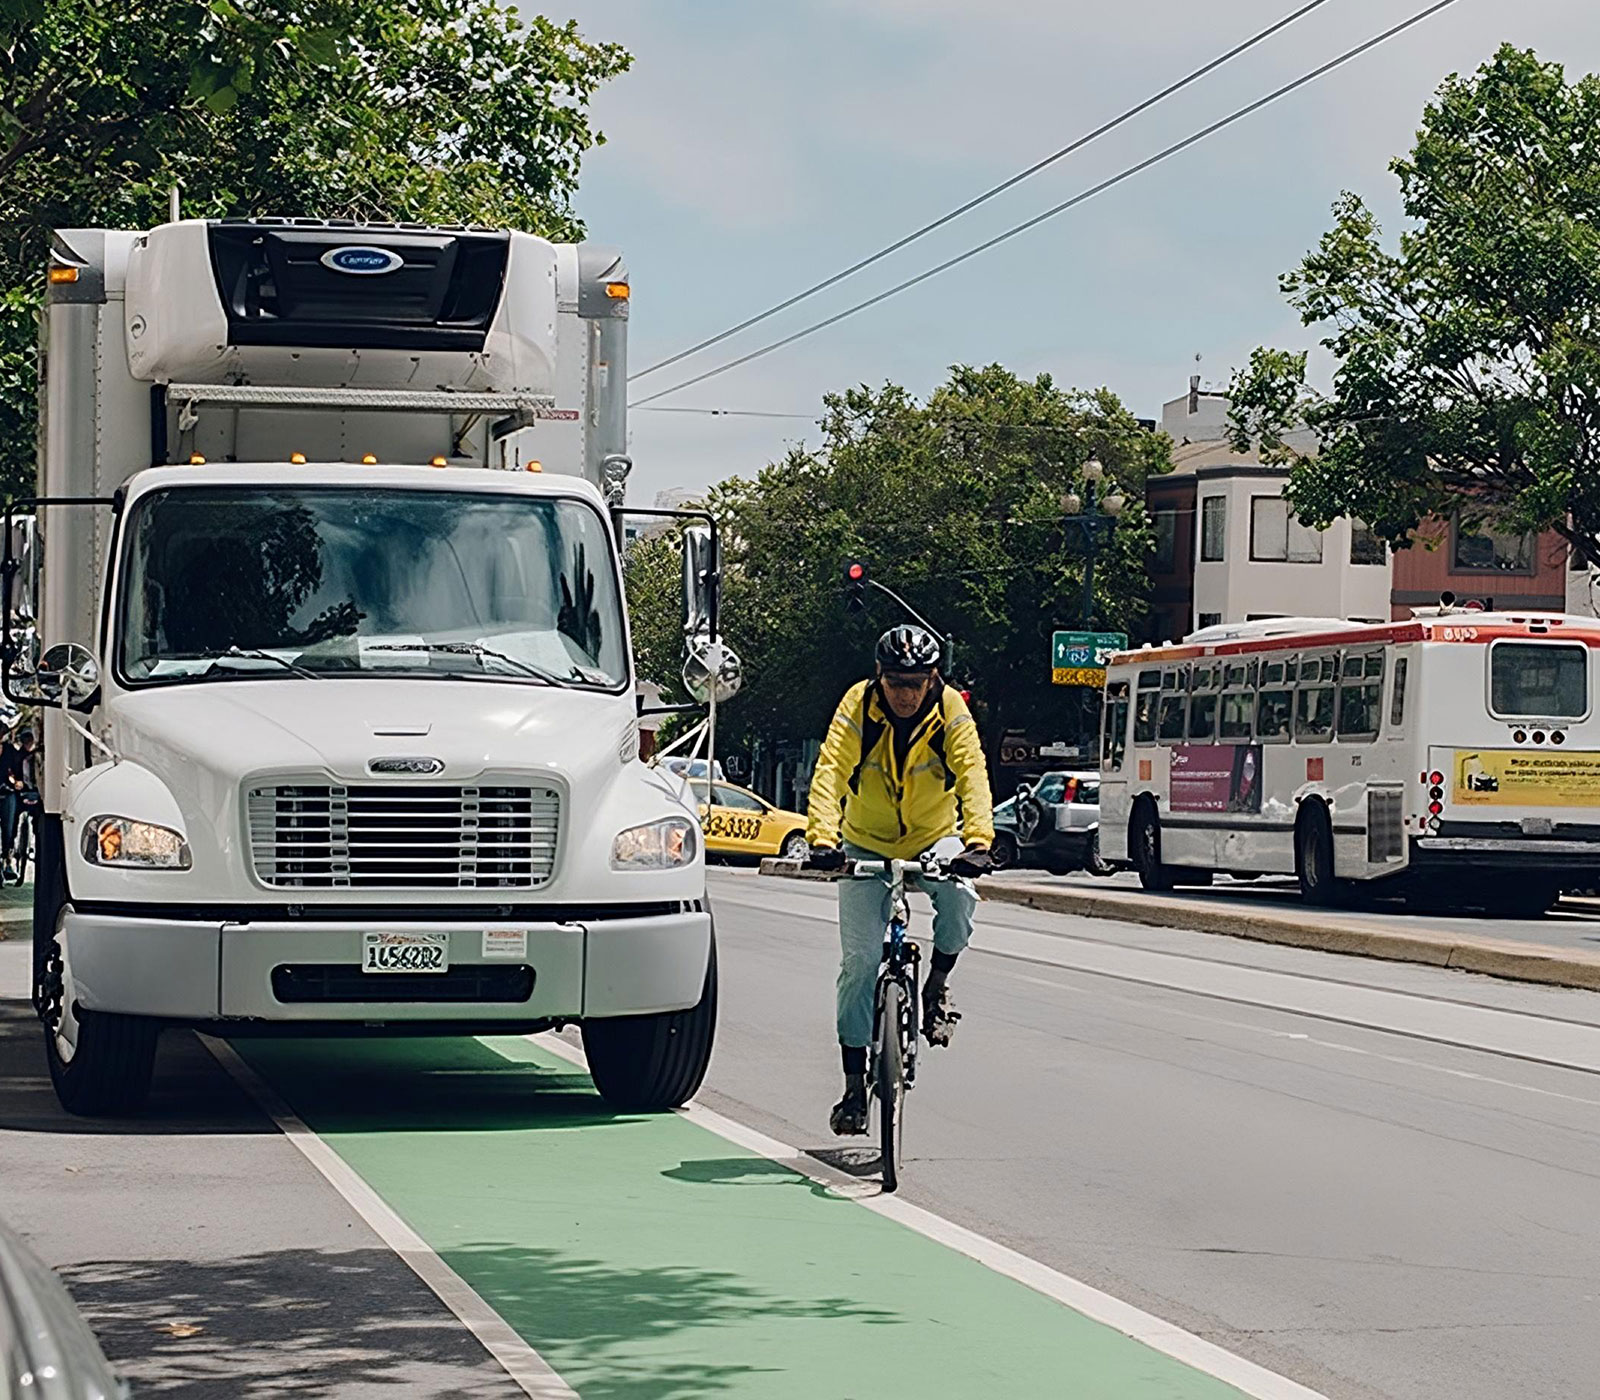
Traffic Enforcement
San Francisco, CA
In May 2022 we submitted a public records request for every moving violation the San Francisco Police Department had written in the past five years. This project visualizes and analyzes traffic enforcement activity between January 2018 – May 2022 specifically examining the percentage of citations for the most dangerous violations that result in serious injury and death such as speeding and running red lights. This project also analyzes traffic enforcement activity in Equity Priority Communities where residents have been historically harassed for non-life-threatening moving violations such as broken taillights and expired tags. These violations are often used to initiate pretextual stops in low-income, communities of color.